Becoming Metrics Literate: New Study Examines Videos on the H-index
Scholarly metrics are widely applied to assess research quality and impact despite their known limitations. One of the most popular scholarly metrics is the h-index—which is defined as the “h number of papers with at least h number of citations.” This means that if a researcher has an h-index of 12, they have published 12 papers with at least 12 citations each.
Although simple, the h-index is flawed and often applied inappropriately. It’s been criticized due to inconsistencies, lack of field normalization, database-dependence, and time-dependence. Yet the h-index continues to be used for hiring, review, and tenure.
Lauren Maggio, professor of medicine at the Uniformed Services University of Health Sciences, has witnessed how academics misuse metrics in high-stakes decisions. Across her career, sitting on many hiring committees, she has “unfortunately seen candidates compared in relation to their h-index,” despite its shortcomings.
“It’s really important that people understand how these metrics are created, that they understand some of the biases and issues that are baked into these metrics that may disadvantage some groups,” she says. In this post, Lauren tells us about the ScholCommLab’s recent work characterizing available educational videos on the h-index.
“It’s really important that people understand how these metrics are created, that they understand some of the biases and issues that are baked into these metrics that may disadvantage some groups.”
Lauren Maggio
Improving Metrics Literacies through educational videos
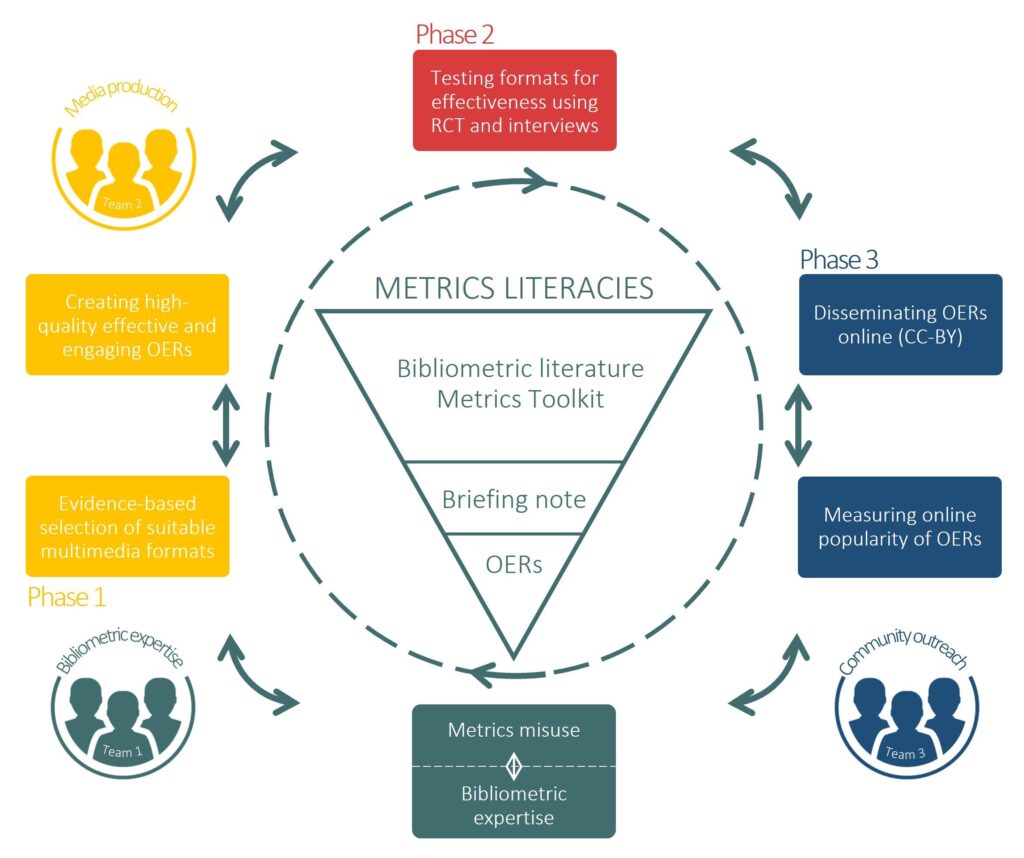
The project, led by Stefanie Haustein, co-director of the ScholCommLab, aims to improve the appropriate use of scholarly metrics in academia. The team is developing educational videos and evaluating their efficiency in a randomized controlled trial to teach academics “Metrics Literacies,” the skills and knowledge to recognize, interpret, critically assess, and effectively and ethically use scholarly metrics.
The multidisciplinary team consists of bibliometric experts, video producers, and online education specialists, including Lauren. “Stefanie asked me to jump on this because of some of the work I’ve been doing in the medical education space,” she says. They decided to start by developing open educational resources about the infamous h-index.
Before making their own content, the team assessed the landscape of existing educational videos on the h-index. By understanding available resources, Lauren believes that they could “get a sense of how people were actually talking about the h-index, what it is, issues with it” to identify content for their own future initiatives. “We could find good things to do for our own videos or bad things that we knew we wanted to avoid,” she added.
In their first study, recently published in PLOS ONE, the Metrics Literacies team examined the characteristics of available educational videos on the h-index. They identified more than 247 videos to get a sense of how the h-index is described and presented. “We watched a ton of YouTube,” laughed Lauren.
Only 31 videos met the inclusion criteria (English-speaking, less than 10 mins long, and actually about the h-index). At least two of the authors independently coded each of the videos based on their content, presentation style, and educational quality.
Specifically, the team used Cognitive Load Theory—an instructional theory to guide educational design—to evaluate whether the video format actually helped people learn. Based on this theory, ideal educational videos should be designed to balance three types of cognitive load:
- Reduce extraneous load—unnecessary design features that prevent new information from being processed (e.g., background noises)
- Minimize intrinsic load—the inherent difficulty of new information. Complex tasks cannot be made easier, but the learning burden can be reduced by breaking down content (e.g., segmenting)
- Increase germane load—resources required to facilitate learning. Presenting content in different ways enhances learning (e.g. using audio to explain something, while also showing it with video)
Their results suggest that when it comes to building literacies about the h-index, the scholarly community has a long way to go.
Most h-index videos use elements to balance cognitive load
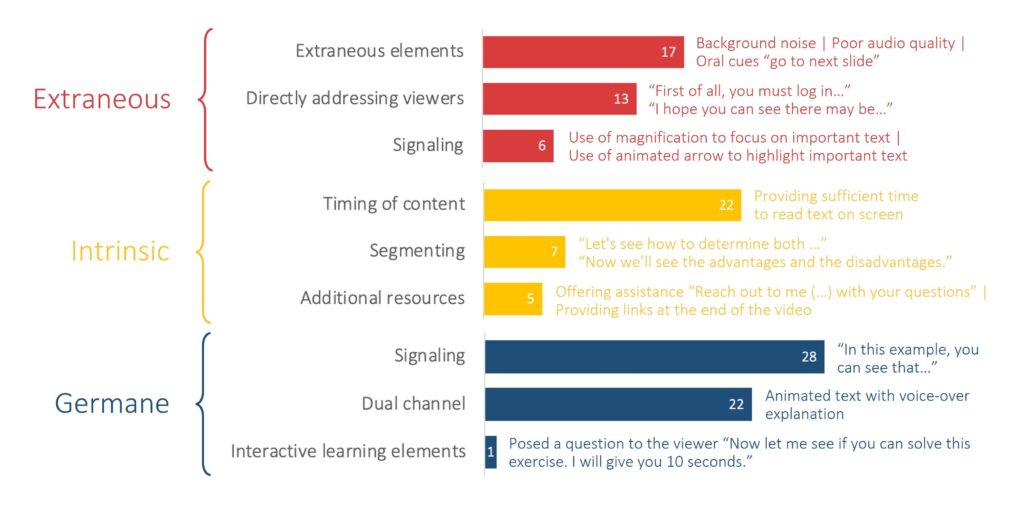
Most of the videos used elements to balance cognitive load. 90% of videos used signaling (or cues highlighting important details) and 71% used dual channel approaches (like animated text with voice-over explanations) to enhance cognitive processing and reduce germane load. 42% of videos actually addressed the viewer, reducing extraneous load.
Interestingly, only one video included an interactive learning element. 97% of videos did not pause to ask a question, pose a reflection, or attempt a calculation—which are tools that can facilitate the learning process. The lack of interaction in the videos could be due to the nature of the medium, but Lauren believes “It is possible to do those things. They just weren’t taking advantage of that.”
The research also made it clear that there is lots of room for when it comes to minimizing distractions unrelated to learning. 55% of video included non-productive distractions, which increases extraneous load. Lauren found the distractions to be extreme in several of the videos. “You could hear birds, pretty loud, that would just really distract you, or they would be doing a screencast and just be moving their mouse everywhere,” she recalls. She recommends that future initiatives should try to be more mindful of reducing these extraneous elements.
Current videos hardly mention inconsistencies or usefulness of the h-index

While most videos defined or calculated the h-index, 48% of videos did not mention any caveats. There were no mentions of disadvantages to early career researchers (77%), database differences (71%), or disciplinary differences (61%). In fact, Lauren saw that “There were presenters very much proposing and helping viewers to think about how to boost their h-index, which shouldn’t really have been a surprise.” The lack of critical reflection in the videos fails to provide transparency on the shortcomings of the h-index.
Available videos on h-index appear amateurish
68% of the videos displayed amateurish production quality. These videos had poor camera angles, audio quality, and editing, which added distractions and disrupted the learning experience. In contrast, the professionally produced videos the team identified flowed smoothly, incorporating images and animations with scripted dialogue. For the team, this findings highlights the importance of involving online education specialists and video producers for developing future videos.
A bright future for the Metrics Literacies project
Thanks to funding from SSHRC, Lauren is excited for what’s next: creating and testing three educational videos on the h-index. “This was really the background work. Now we’re starting to think about how we actually create the video and how we are going to measure what’s happening.”
But the road toward making people metrics literate doesn’t stop here. All of the Metrics Literacies’ resources are open through Zenodo. Lauren envisions that anyone could adopt their approaches and materials, using them to improve literacies about other scholarly metrics. In her words, “If we care about science itself, and we want science to be sound and ethical, then we really should be very mindful of what we’re doing with our metrics.”
To stay up to date with the Metrics Literacies project, sign up for the ScholCommLab newsletter. Visit Zenodo to access all of the Metrics Literacies outputs.
[…] From a ScholCommLab Post: […]
[…] We used Cognitive Load Theory to assess the videos: […]