

Three questions with... parth!
Our lab is growing! In our Three Questions series, we’re profiling each of our members and the amazing work they’re doing.
This post introduces parth sarin, researcher at the Graduate School of Education at Stanford University, organizer of the Collaborative Metadata (COMET) project, and research affiliate of the Public Knowledge Project. In this interview, parth shares some of their exciting work, including a recent series of art installations at Stanford!
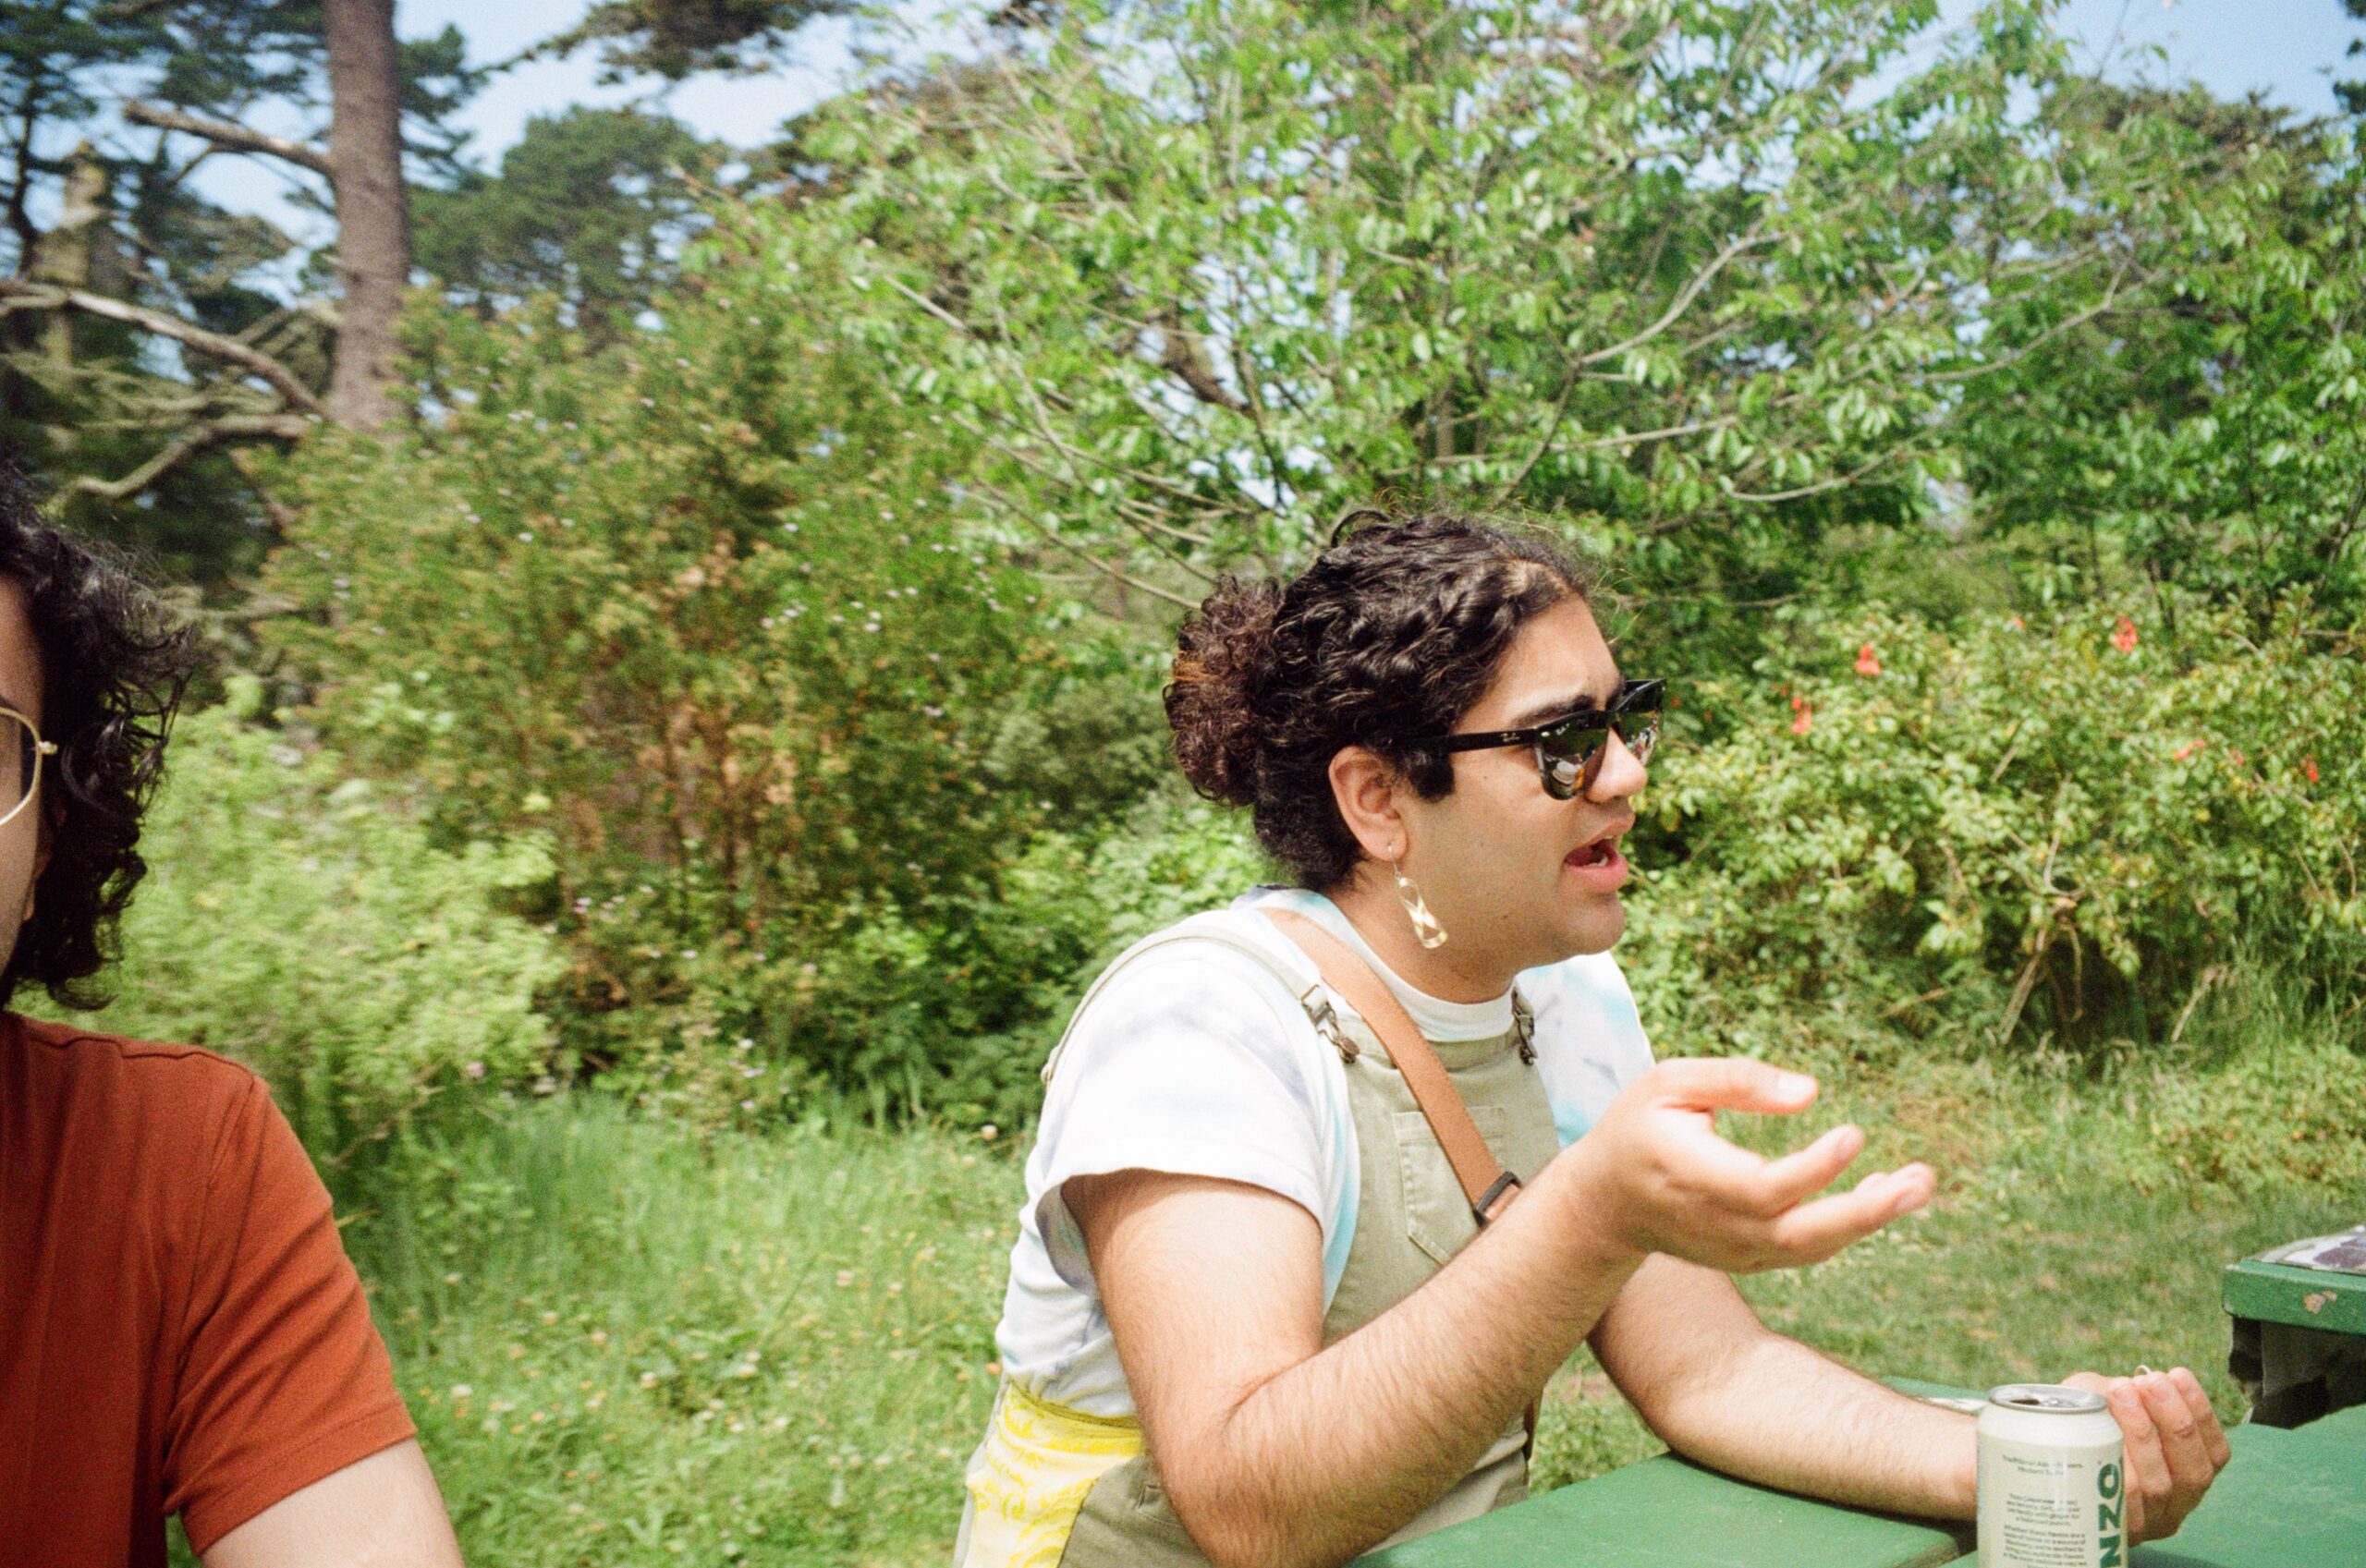
Q#1 What are you working on at the lab?
I’m working on a few projects — scraping articles from OJS, metadata enrichment and publishing workflows, and potentially even automated full-text JATS production. I love working in the lab! Mostly, I enjoy everyone’s creativity and openness to exploring very new approaches to very old problems.
Q#2 Tell us about a recent paper, presentation, or project you’re proud of.
I’m fascinated by algorithmic recognition, the internal feelings that people have when they feel labeled — correctly or incorrectly — by an algorithm. Increasingly we are surrounded by algorithms that make judgements about who we are — what kind of media we’d like to consume, whether we deserve a loan, whether we should be targeted in campaigns of deportation and genocide.
Last year, I did a series of art installations at Stanford that tried to capture this with the metaphor of a “digital self” that was related to, but separate from, each of the viewers of the exhibit. It was my first time doing a serious projection mapping exhibition, and I learned a lot!

Q#3 What’s the best (or worst) piece of advice you’ve ever received?
My friend once told me “all deadlines are suggestions — there are pros and cons to meeting them, but we shouldn’t treat them as if they’re gospel.” I think this is good advice, especially for academics, since the academy socializes tardiness (of course, this friend is a professor).
DOI: https://doi.org/10.59350/7tmda-59096


Three questions with... Katerina!
Our lab is growing! In our Three Questions series, we’re profiling each of our members and the amazing work they’re doing.
This post introduces Katerina Vasilas, Executive Assistant to Dr. Stefanie Haustein and master’s student at uOttawa’s School of Information Studies. In this interview, Katerina talks about what excites her about joining the lab and shares how turning to poetry helps her reflect and gain perspective when she needs advice.

Q#1 What are you working on at the lab?
I’m excited to be joining the lab and to begin working with Professor Haustein. I’m looking forward to supporting ongoing research, helping with day-to-day lab tasks, and learning from the inspiring work everyone is doing.
Q#2 Tell us about a recent paper, presentation, or project you’re proud of.
Last semester, I took Professor Haustein's class on Knowledge Organization. The final project was to develop a report analyzing and evaluating the open literature and citation database OpenAlex, specifically their use of Topics. My group analyzed the field of 'Neuroscience' using a mixed-methods approach to examine the distribution of 199 topics across eight subfields, the quality of their classification relationships, and indexing accuracy. I really enjoyed using various descriptive statistical models and analyses to illustrate opportunities for classification improvements.
Q#3 What’s the best (or worst) piece of advice you’ve ever received?
Usually, when I need advice, I turn to Mary Oliver’s Devotions and flip through it until I find a poem that feels right for whatever I’m going through. It’s not advice per se, but it often prompts reflection. I’ve found that many of our troubles can be better understood through their connection to the natural world and its cycles.
DOI: https://doi.org/10.59350/9j4zz-p4f28

Three questions with... Cathy!
Our lab is growing! In our Three Questions series, we’re profiling each of our members and the amazing work they’re doing.
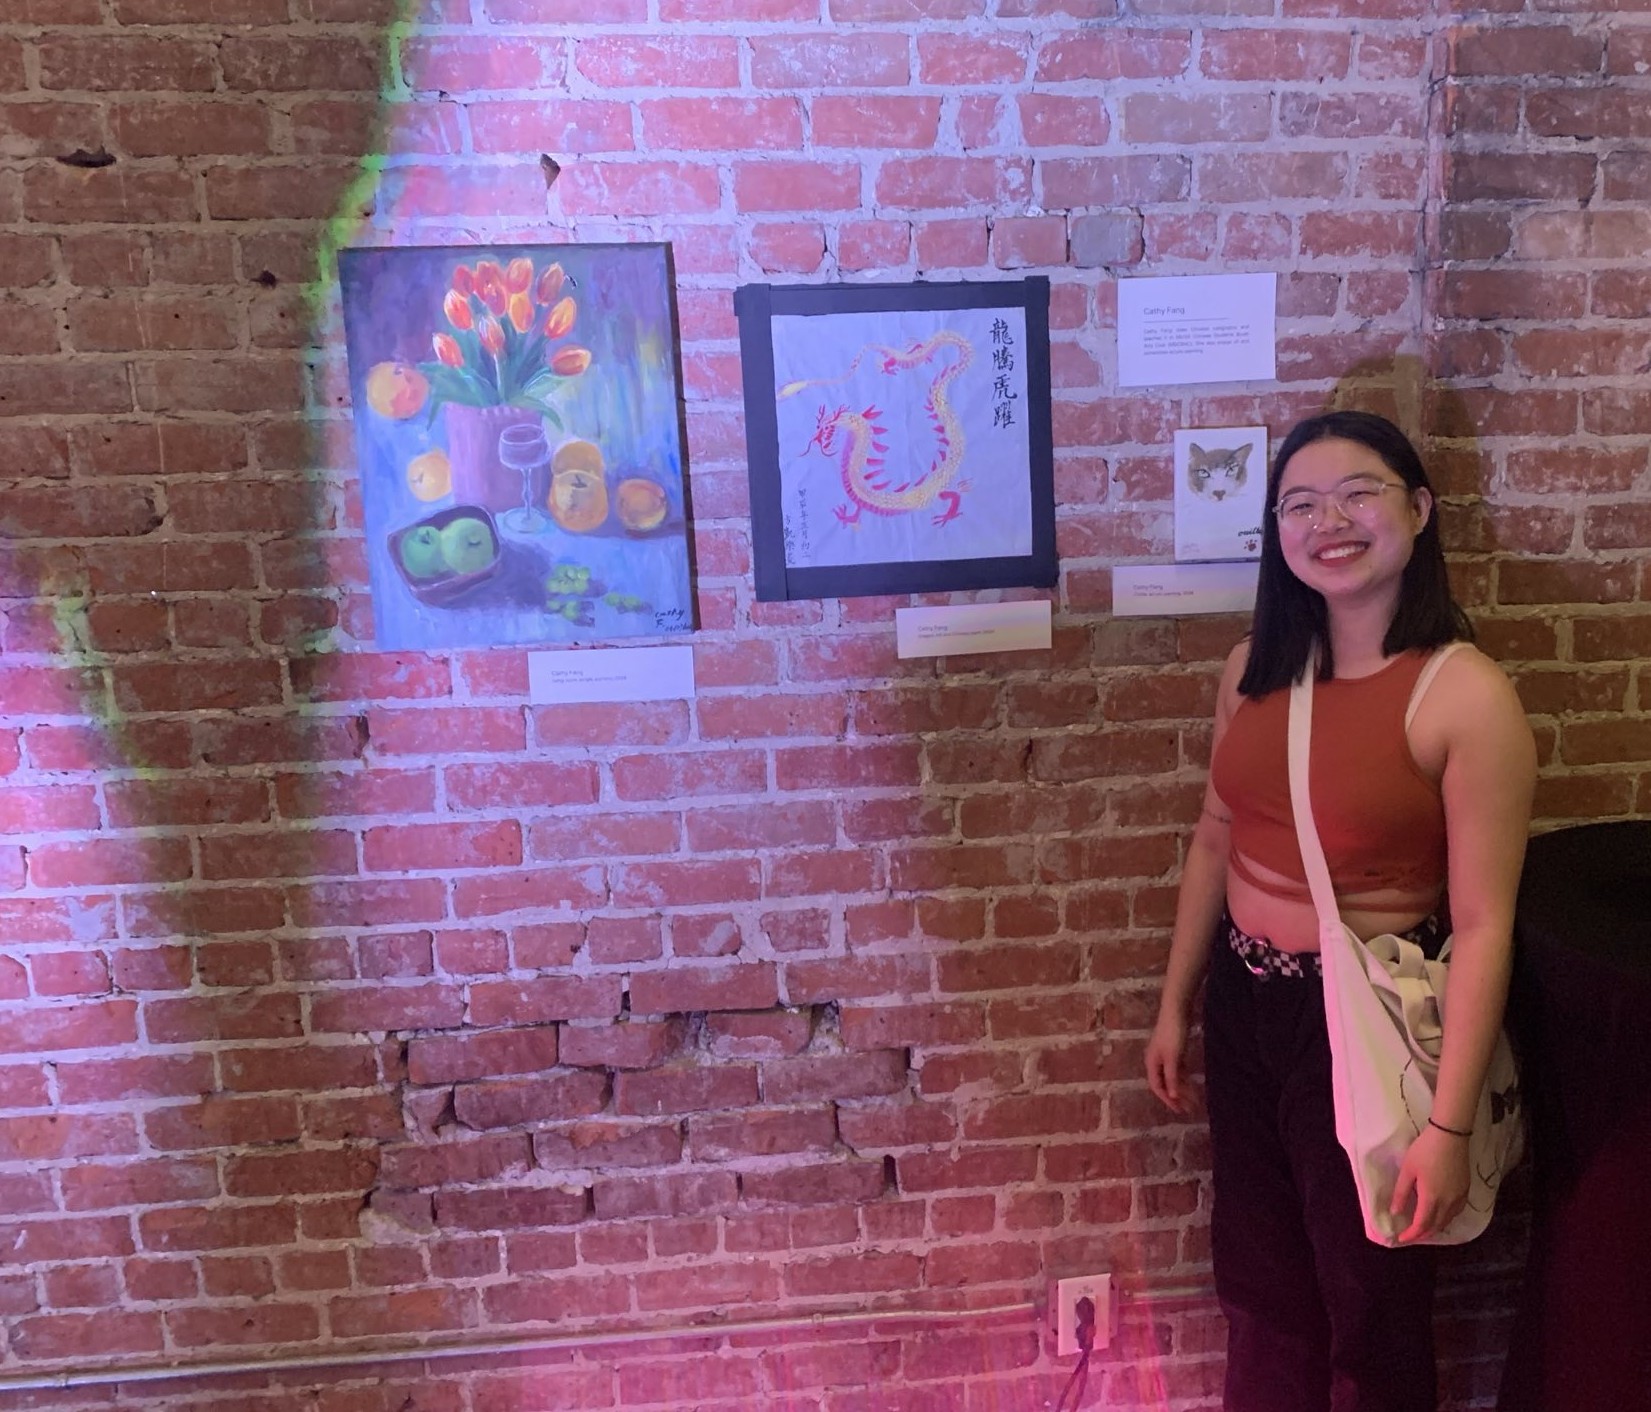
This post introduces Cathy Fang, a student at the ScholCommLab. In this interview, Cathy talks about what excites her about her current and future work, and shares some of her beautiful artwork with us!

Q#1 What are you working on at the lab?
I’m working on a brief literature review of the field of metascience. I’m excited to learn more about this topic and communicate it to the research community.
Q#2 Tell us about a recent paper, presentation, or project you’re proud of.
I’m most excited about a narrative review on the scholarly and societal impacts of open science I've been working on for a quite a while now. I cannot wait to get it out in the world!
Q#3 What’s the best (or worst) piece of advice you’ve ever received?
The best advice I’ve received is to “drink wine before writing your thesis when you hit a writer's block".
DOI: https://doi.org/10.59350/9j4zz-p4f28
Three questions with... Hovagim!
Our lab is growing! In our Three Questions series, we’re profiling each of our members and the amazing work they’re doing.
This post introduces Hovagim Zakarian, a research assistant at the ScholCommLab. In this interview, Hovagim invites us to go with the flow and shares an exciting project involving bees!

Q#1 What are you working on at the lab?
I’m just starting with the lab. I’m excited to start working on the ROARA project as a research assistant. I have experience in quantitative data from my undergrad program, and I’m looking forward to using those skills in a new (to me) field!
Q#2 Tell us about a recent paper, presentation, or project you’re proud of.
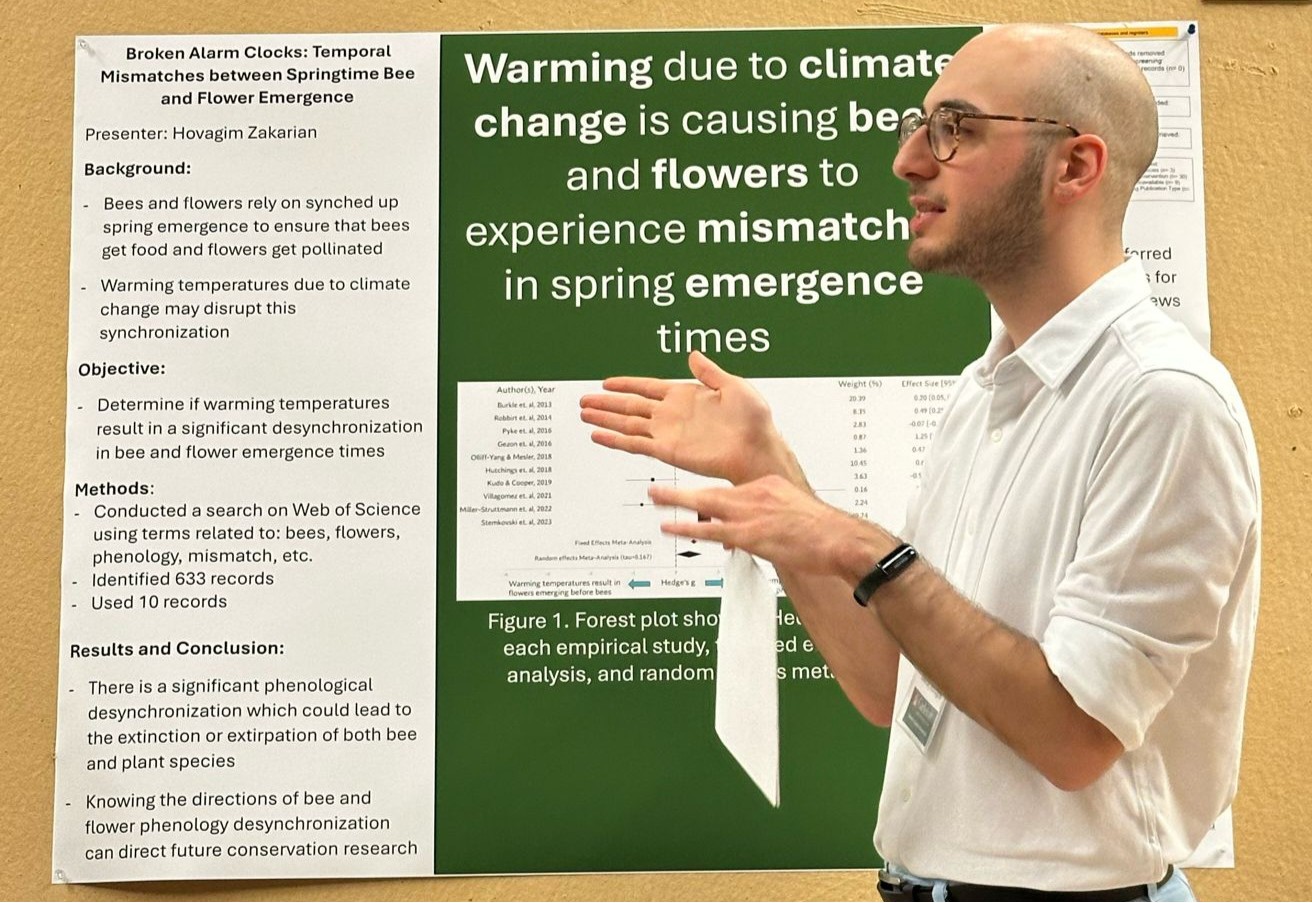
At the end of my undergraduate studies, I worked on a capstone project that was a meta-analysis on (if you’ll forgive me to nerd out a little) bee and flower springtime emergence synchronicity. Specifically, it explored how climate change can mess up this synchronicity. It was honestly a tough project, but it was so rewarding and fun. My love for insects kept it interesting the whole way through!
Q#3 What’s the best (or worst) piece of advice you’ve ever received?
The best piece of advice I ever received was not to worry about things going wrong (obviously, that’s easier said than done!) When you remind yourself that worrying about something bad only makes you suffer twice, both now and when the bad thing happens, it makes it just a little easier to let go of your worries and go with the flow!
DOI: https://doi.org/10.59350/scholcommlab.5841

Three questions with... Belen!
Our lab is growing! In our Three Questions series, we’re profiling each of our members and the amazing work they’re doing.
This post introduces Belen Febres-Cordero, the new manager of the ScholCommLab. In this interview, Belen shares what excites her about her work, both inside and outside the lab, and two pieces of advice from childhood that have shaped her curious and lively approach to research and life.

Q#1 What are you working on at the lab?
I’ve been informally connected with the ScholCommLab community for quite a while, and I’m thrilled to now officially join the team as the lab manager. In this role, I’ll be creating and sharing content, fostering community engagement, providing research support, and working behind the scenes to keep everything running smoothly. As someone who loves collaborating with different people, I’m especially excited to connect with the group members and learn more about the cool, impactful projects everyone is working on.
Q#2 Tell us about a recent paper, presentation, or project you’re proud of.
I hold close to my heart dozens of projects across the Americas that I’ve had the privilege of being part of over the last 15 years. Covering a wide range of areas – including communication, knowledge mobilization, community engagement, critical approaches, creative and participatory methodologies, migration, health, and human rights – they all share the common goal of amplifying underrepresented perspectives to improve communities’ lives according to their own priorities, worldviews, and needs.
I am particularly fond of my doctoral project in health communication, which I recently completed. In this initiative, I collaborated with 59 internal migrant women in Quito, Ecuador, to explore and share alternative expressions of health and well-being. I feel honoured and humbled by what I learned from each participant in the study. These women’s experiences not only change my perspective on what a good life means but also what we need to achieve one. Their presence and input also supported me during family illness and led me to redefine health amidst the COVID-19 pandemic. I’m forever grateful for the friendships I built with participants and collaborators during this challenging time.
Q#3 What’s the best (or worst) piece of advice you’ve ever received?
So many great pieces of advice I’ve been lucky to receive come to mind, but two of them stand out. From a young age, my grandpa pushed me to question anything I’m told or taught, regardless of the source, until I can justify it myself. This advice first sparked my love for research, as it motivated me to approach the world and my own beliefs through a critical and curious lens.
The second piece of advice came from a poster hanging in my mom’s office at the daycare she used to own. “Play is the highest form of research,” it read. I feel like the kid doing the puzzle, as depicted in the poster, every time I do something even remotely related to research. Inspired by this memory, I now have a self-made sign in my office that says: “Research is the highest form of play.” These words remind me that, while I should always approach work and life with both rigor and high standards, I must also make space for wonder, whimsy, and joy.
Find out more about Belen’s work on LinkedIn.
Swiss Year of Scientometrics Lecture: Opportunities and Challenges of Scientometrics–Part IV
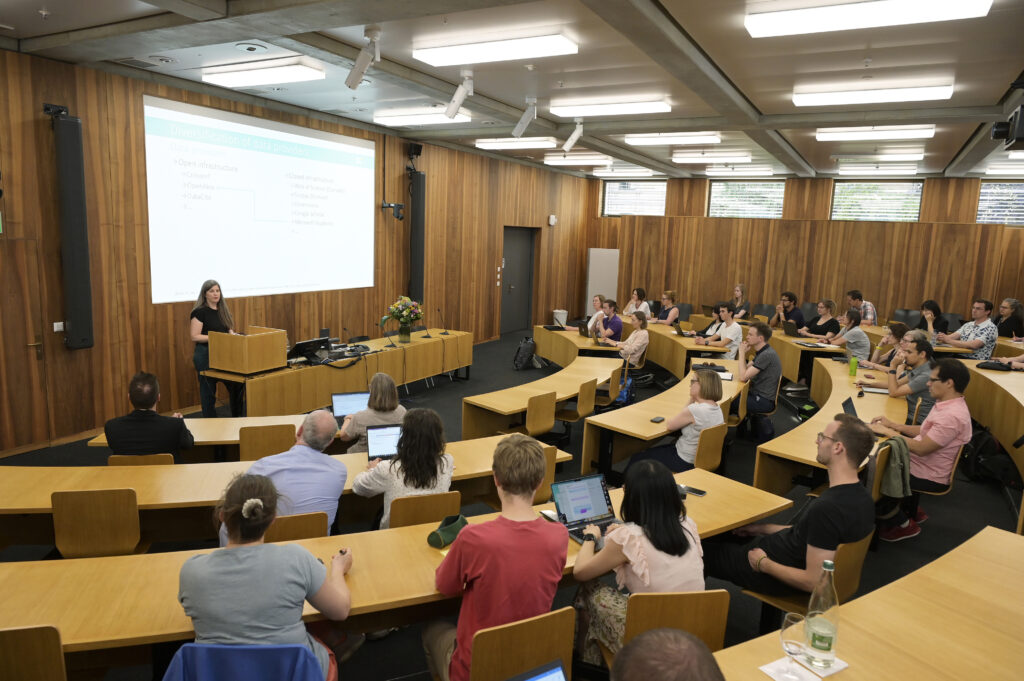
This blog post is the last of a four part series based on the keynote presentation by Stefanie Haustein at the Swiss Year of Scientometrics lecture and workshop series at ETH Zurich on June 7, 2023.
Responsible use of metrics
As a last topic, I want to address a very important area that I think for a very long time has been ignored by the scientometric community—namely the use of the metrics that it creates and computes.
Research assessment reform
We all know that we live in a “publish or perish” culture, much of which has been created by quantitative measurements of scientific productivity and impact.
Metrics—such as the journal's impact factor (JIF) and h-index—are used to make critical decisions about individuals, including review, promotion, tenure (RPT), funding, and academic awards. The importance of quantitative metrics has changed scholarly communication and publishing, and created a range of adverse effects, such as plagiarism, “salami publishing,” authorship for sale, and citation cartels.
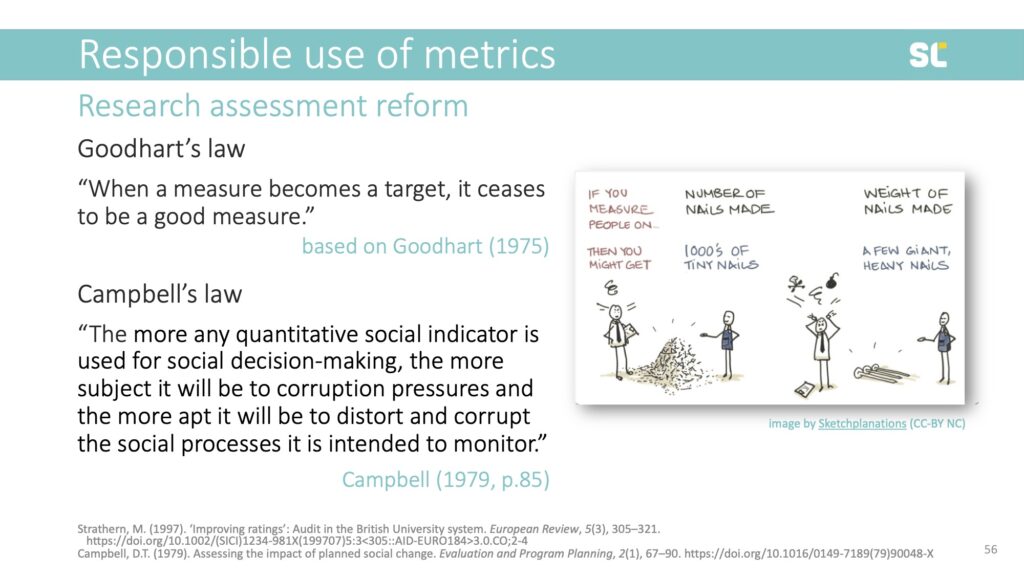
These adverse effects can be described by Goodhart’s and Campbell’s laws. By setting a metric as a target and by linking that target to a reward structure, we create an incentive for that metric to be gamed.
There are some examples of quantitative metrics that have actually reached desired goals of improving research productivity. A recent example comes from Indonesia, where policies instated by the Widodo administration increased the number of publications in Scopus-indexed journals.
The policies included a decree that requires PhD students to publish one paper in an international journal, the creation of the SINTA database indexing Indonesian publications and ranking scholars by a “research score,” and even a law imposing financial penalties on senior academics who do not meet a certain publication output. Below, you clearly see the increase in publication output after the policy change.
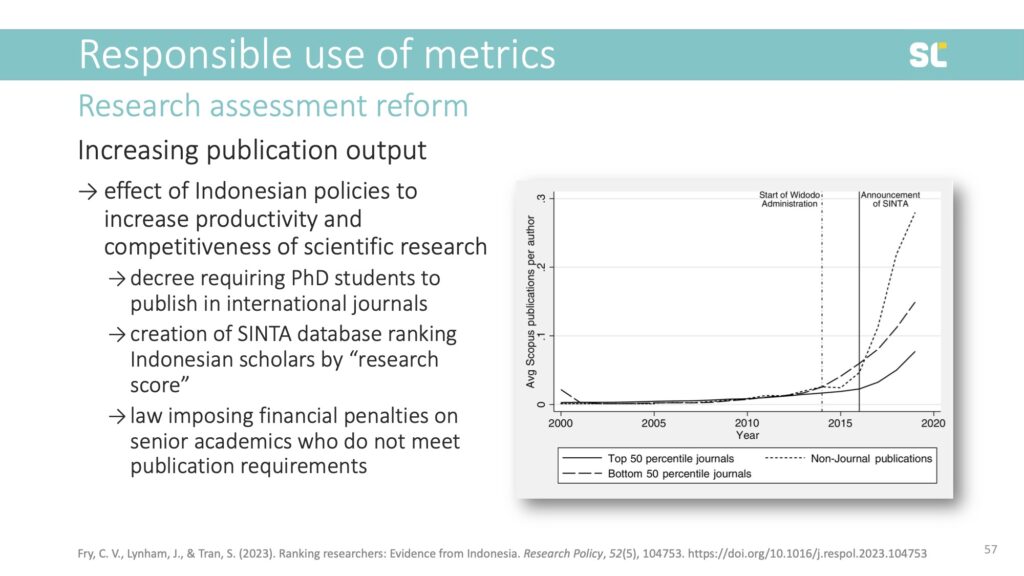
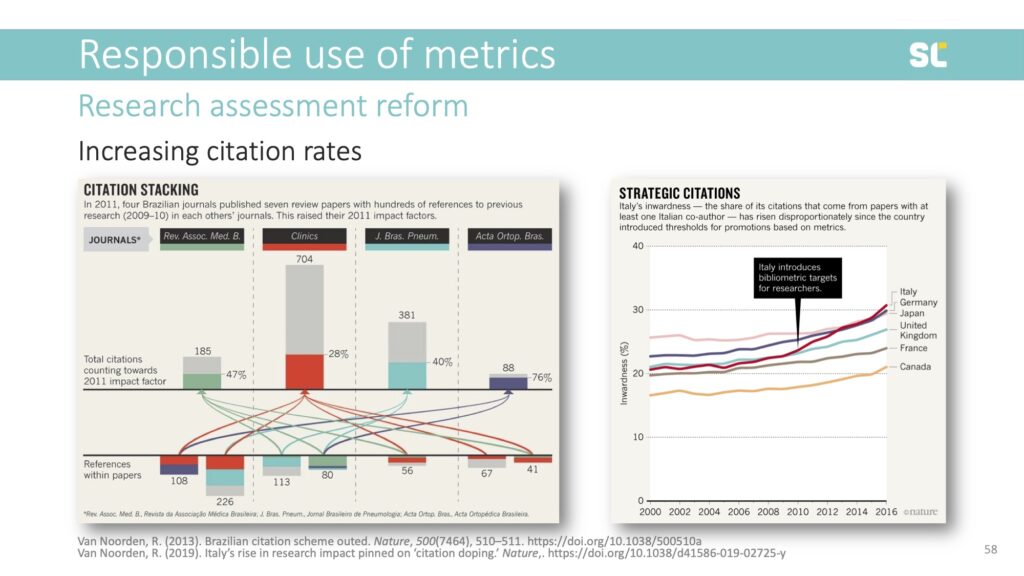
Unfortunately, we frequently see issues where researchers try to game metrics and metrics cause so-called adverse effects. In the slide below, you see an example of “citation stacking” (left image)—where journals try to increase their impact factors by citing each other’s papers published in the two previous years. Citation databases now monitor stacking and suspend journals. Another example is “citation doping” (right image), where you could see a significant rise in self-citations after Italy introduced bibliometric targets for researchers in 2010.
Since the current form of research assessment is harming research and researchers in all disciplines, there are some initiatives that are trying to reform it:
- The San Francisco Declaration on Research Assessment (DORA) is now turning 10 years
- The Leiden Manifesto for Research Metrics was launched in 2015 by the scientometric community
- The Coalition for Advancing Research Assessment (CoARA) was formed in 2022
For example, CoARA’s core commitments include using quantitative indicators only as a supplement to support peer review, abandoning inappropriate use of metrics (particularly the JIF and h-index), and avoiding the use of university rankings.
CoARA also prominently stresses the importance of evaluating practices, criteria, and tools of research assessment using solid evidence and state-of-the-art research on research, and making data openly available for evidence gathering and research.
These are all steps in the right direction but behavior change can take a long time, particularly in academia.
Metrics Literacies
Lastly, I want to talk about how we can educate researchers and research administrators about responsible use of scientometric indicators.
I want to introduce what we call “Metrics Literacies,” an integrated set of competencies, dispositions, and knowledge that empower individuals to recognize, interpret, critically assess, and effectively and ethically use scholarly metrics.
While Metrics Literacies are essential, there is a lack of effective and efficient educational resources. We argue that we need to educate researchers and research administrators about scholarly metrics.
In the context where every researcher is already overwhelmed with keeping up with the literature in their own fields, videos are more efficient and effective than text. Storytelling and personas can help to draw attention and increase retention.
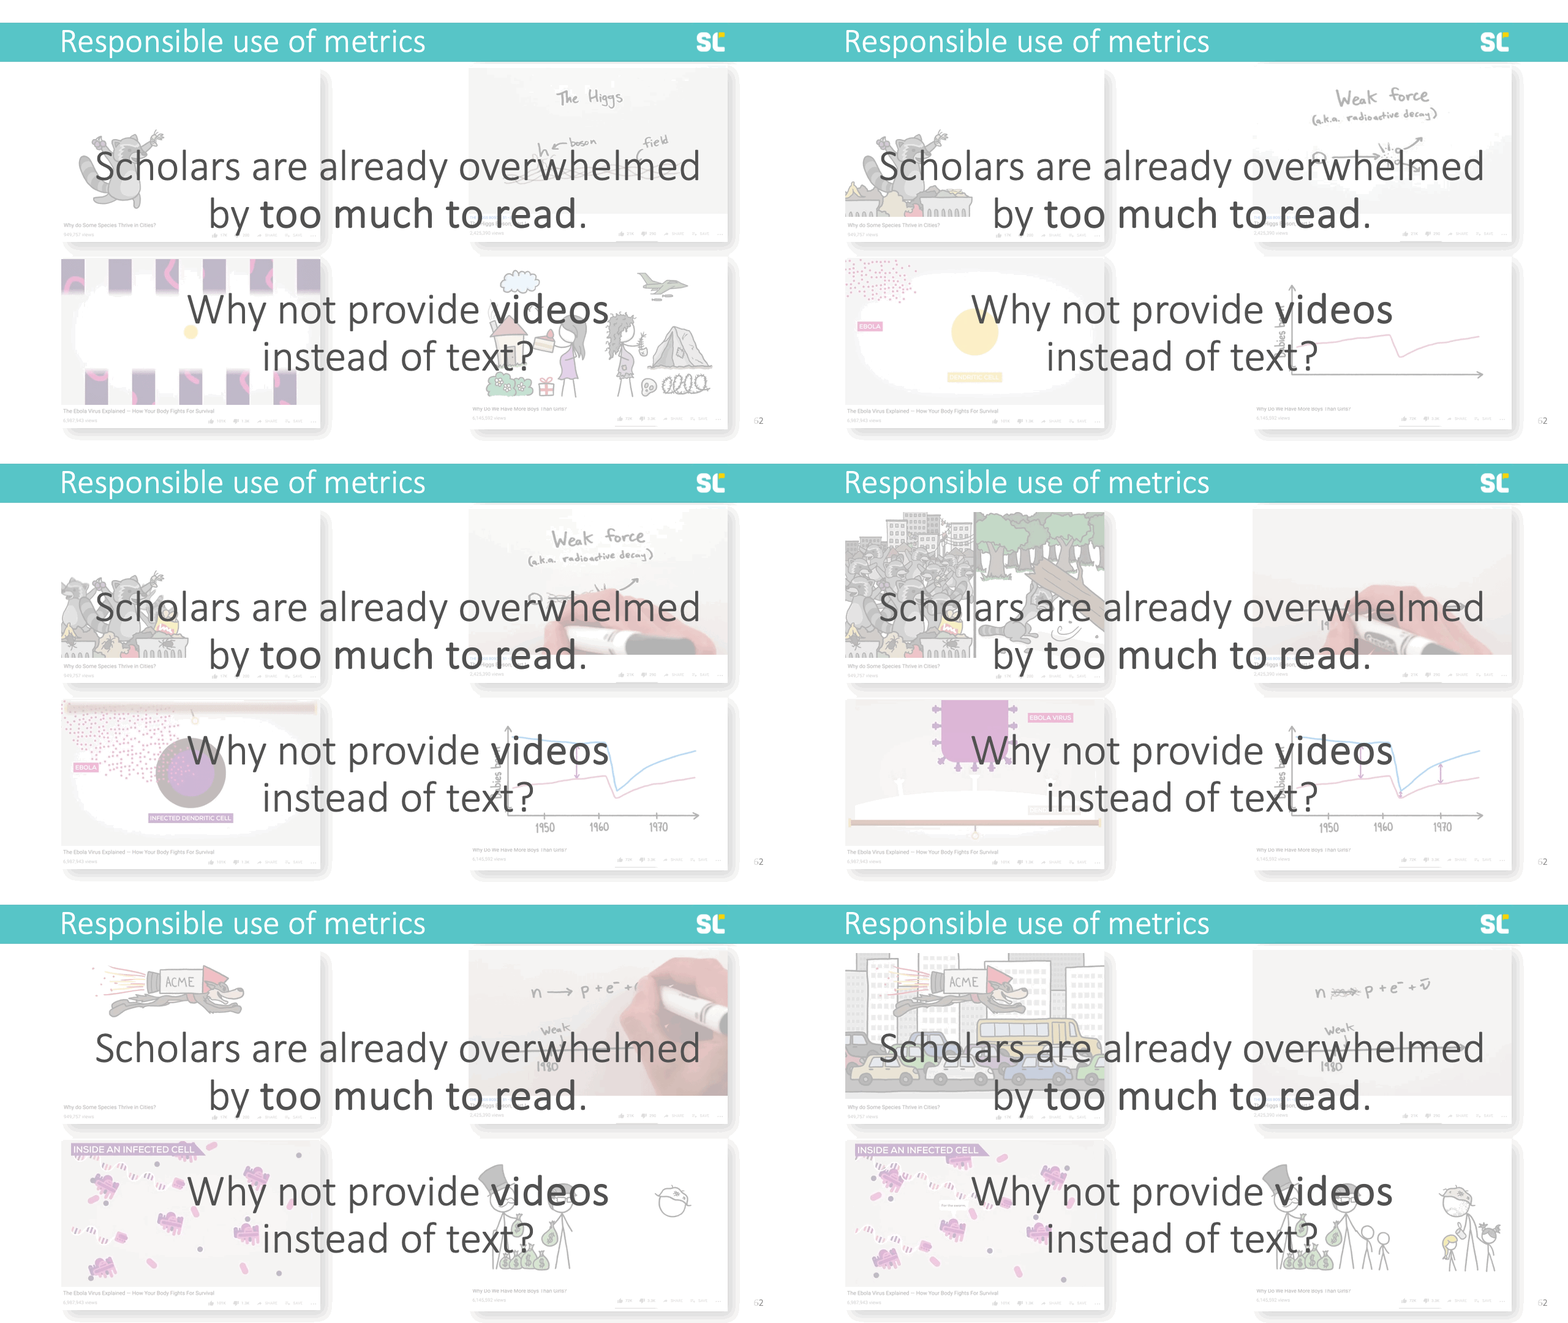
So we are currently planning a randomized controlled trial to test the effectiveness of different types of educational videos, using the h-index as an example.
Before producing our own educational videos about the h-index, we assessed the landscape of existing videos on Youtube, reviewing 274 videos and coding 31 that met the inclusion criteria according to a codebook with 50 variables.
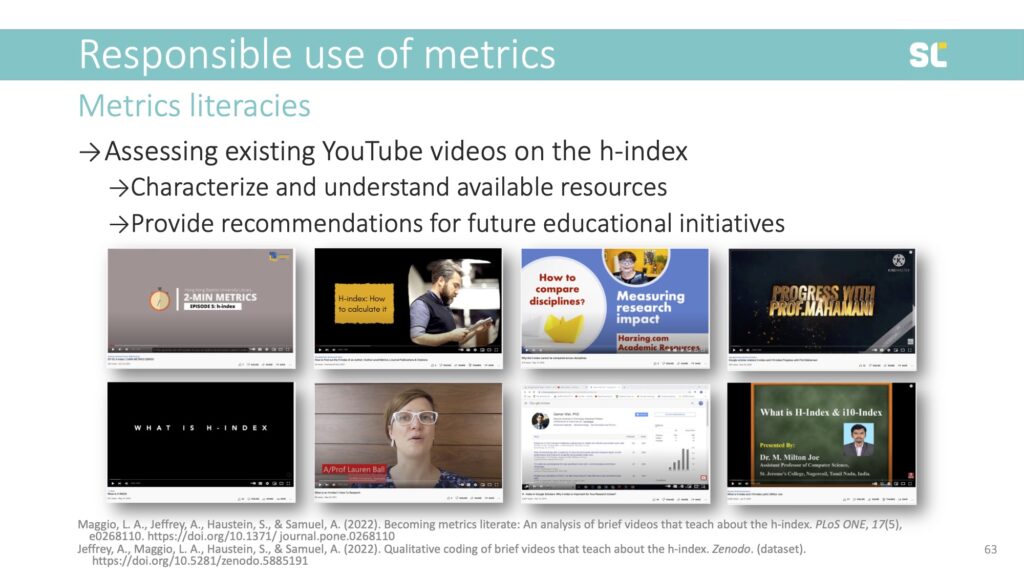
We used Cognitive Load Theory to assess the videos:
- Extraneous cognitive load requires cognitive processing that is not related to learning and should be reduced. This includes non-productive distractions (e.g., background noise).
- Intrinsic cognitive load is associated with inherently difficult tasks or topics, this burden can be reduced by breaking down content (e.g., segmenting).
- Germane cognitive load refers to the resources required to facilitate learning, which can be enhanced by presenting content multi-modally (e.g., dual channel).
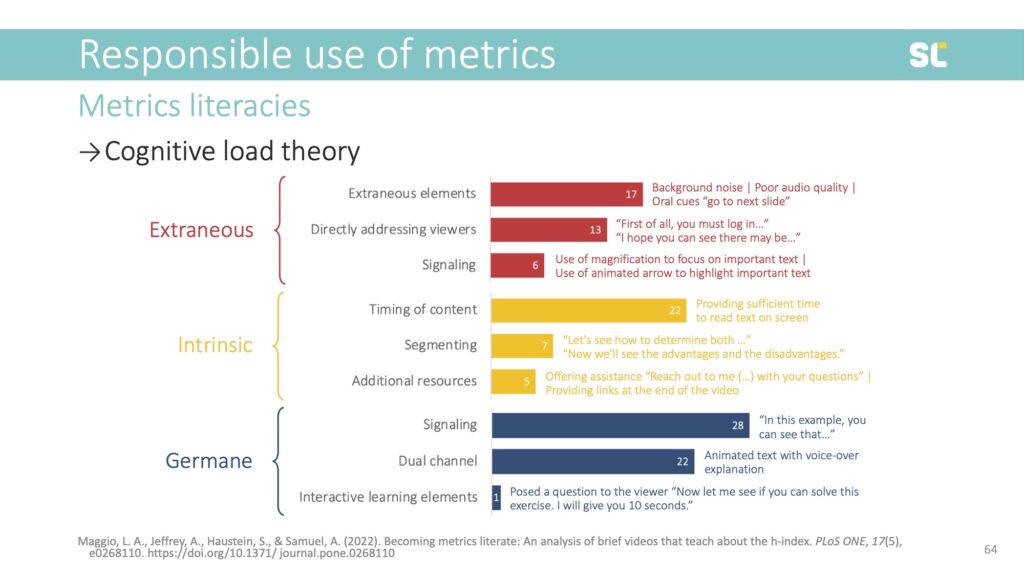
We found that among existing videos about the h-index, 22% do not define the metric and almost half do not address any of its caveats. For example, 61% do not address disciplinary differences and 77% do not mention its inability to assess early career researchers. This is highly problematic because it further promotes the inappropriate use of this flawed indicator.
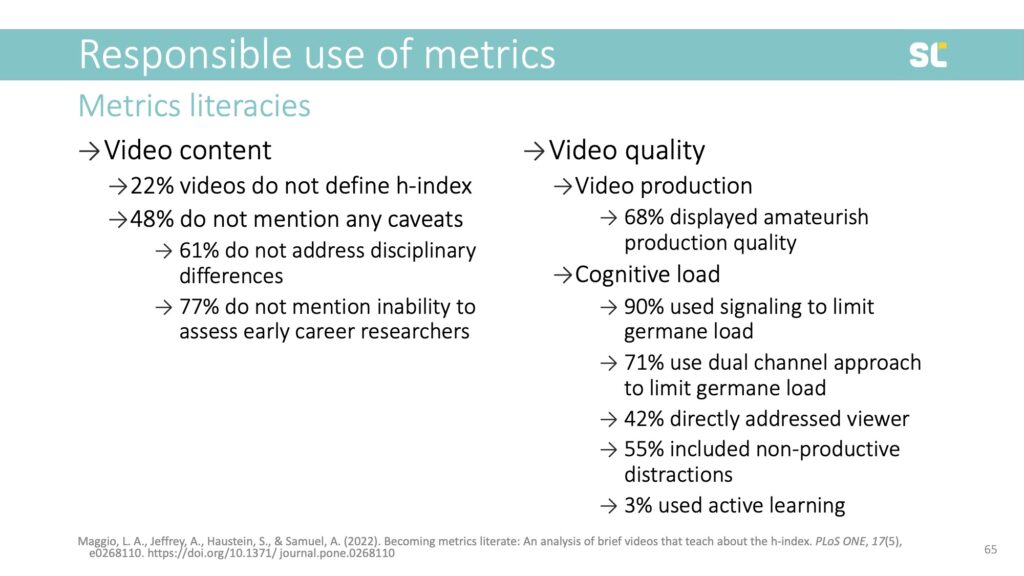
From the perspective of production quality, we found that most videos seemed amateurish and more than half contained non-productive distractions. Only one of the 31 coded videos used active learning elements.
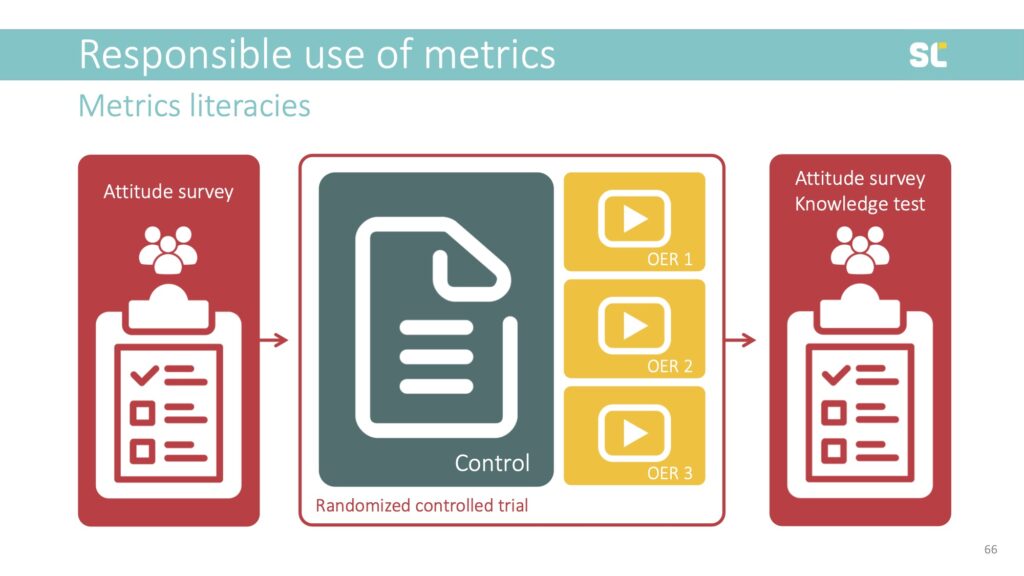
We are currently preparing the production of three videos about the h-index, using different educational video formats (e.g., talking head and animations) to set up a randomized controlled trial to test their effectiveness against the control—a regular academic text, which represents the traditional modality of scholarly communication but is believed to be less efficient and engaging as an educational resource.
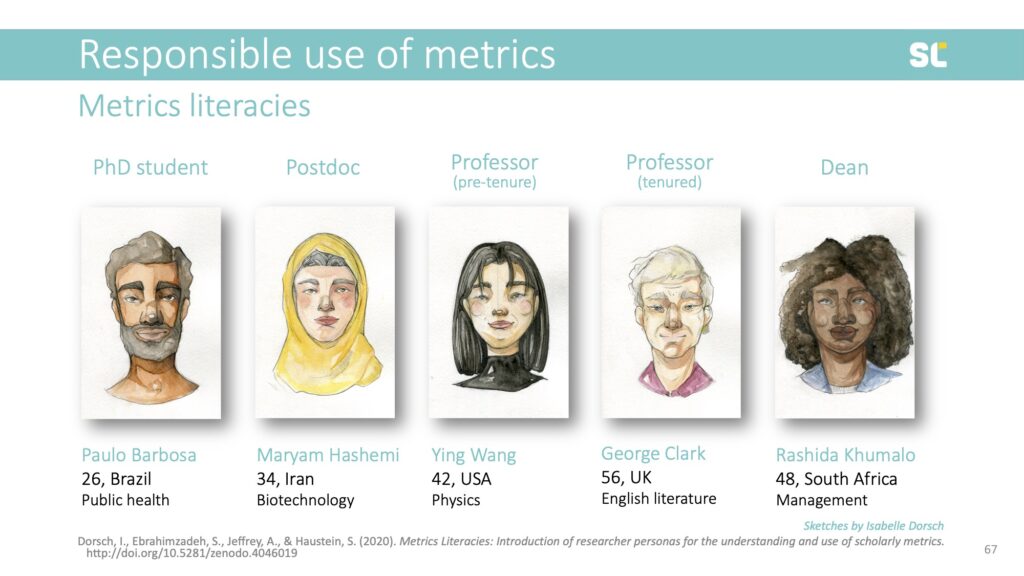
We developed personas and are employing storytelling elements to improve retention and make the videos more engaging. The personas come from different cultural and disciplinary backgrounds, and are at various career stages and roles to allow viewers to identify with them.
We believe that it needs experts in scientometrics, online education and video producers to work together to fill the current gap in metrics education in order to promote the responsible use of metrics in academia.
Conclusions
To wrap up this talk, I would like to summarize what I think are the most important opportunities and challenges of scientometrics today.
Opportunities
1. New citation databases. Current developments of new citation databases, particularly the community-led open ones, are exciting as they can potentially make research evaluation more inclusive and diverse, in terms of the researchers and types of research outputs considered.
2. Full text indexing. With more and more publications being available open access and in machine-readable format, there is a huge opportunity to further develop scientometric indicators taking into account citation context or even by complementing formal citations listed in the reference lists with mentions in the full text (as I have shown for capturing research data reuse).
3. Evidence base for changing policy. There is a huge opportunity for scientometric methods and experts to be involved in creating an evidence base to monitor science policy changes, particularly in the context of open science, open access, and research assessment reform, where policies explicitly emphasize the important role of meta research.
Challenges
1. incomplete or incorrect metadata. Incomplete or incorrect metadata may lead to the same or similar bias and lack of visibility for research from particular disciplines, countries, or publishers. I think it is up to us as the scientometric community to contribute and invest in improving this open infrastructure.
2. Data-driven indicator development. There is still a challenge of scientometric indicator development being almost exclusively data-driven, measuring what is easy to measure instead of what is desirable.
3. Misuse of metrics. Simplistic and often flawed indicators—such as the h-index, JIF, or even absolute citation counts—are all easier to obtain for the average user than more sophisticated normalized metrics and benchmarks.
4. Dominance of for-profit companies that continue to control infrastructure. Finally, I want to emphasize that despite the diversification of scientometric data providers and the growth of open infrastructure, the market of academic publishing and research evaluation is still dominated by a few for-profit companies that control academic prestige and impact.
Thank you!
Check out the Swiss Year of Scientometrics blog for recordings of Stefanie’s lecture and workshop. Visit Zenodo for all Metrics Literacies research outputs.
Swiss Year of Scientometrics Lecture: Opportunities and Challenges of Scientometrics–Part III
This blog post is the third in a four part series based on the keynote presentation by Stefanie Haustein at the Swiss Year of Scientometrics lecture and workshop series at ETH Zurich on June 7, 2023. Stay tuned for our next post, in which we’ll share opportunities and challenges of scientometrics, with a focus on the responsible use of metrics and conclusions.
Diversification of applications
I now want to talk about opportunities and challenges of scientometrics with regards to applications of scientometrics methods.
Collection management
Let’s go back to the roots of scientometrics... One of the first ever citation analyses was done by Gross and Gross, two librarians who decided which journals to subscribe to for a chemistry library.
To quote their 1927 paper in Science:
“One way to answer this question would be merely to sit down and compile a list of those journals which one considers indispensable. Such a procedure might prove eminently successful in certain cases, but it seems reasonably certain that often the result would be seasoned too much by the needs, likes and dislikes of the compiler.
In casting around for a better method of arriving at the answer, the writers decided to seek an arbitrary standard of some kind by which to measure the desirability of purchasing a particular journal. If one grants, to avoid argument, that the department is trying to train men, first, to understand the science of chemistry (including, of course, the methods and means of advancing the frontiers of the science) and, second, to be able actually to contribute to this progress, then it seems inquiry should be made into the library tools which men are using who are now doing just this.
With this purpose in mind, it was decided to tabulate the references in a single volume of The Journal of the American Chemical Society. This journal was chosen as the most representative of American chemistry. It is believed that the results of such a tabulation can be considered statistically and used with certain reservations to predict the future needs for a period, let us say, of ten years. The most recent complete volume (1926) of this journal has been chosen and the results tabulated in such a way that the relative importance of any single periodical for any five-year period can be seen. This is very important when one considers that only relatively few libraries can afford complete files of journals which have been published continuously for a century or more.”
Thus, citation analysis, but also usage analysis based on downloads, can inform collection management.
This is particularly true when it comes to canceling big deals, where having an evidence base of what content contained in bundles is actually used puts librarians in better positions when negotiating with large publishers—particularly those for-profit companies that control more than half of journal publishing.
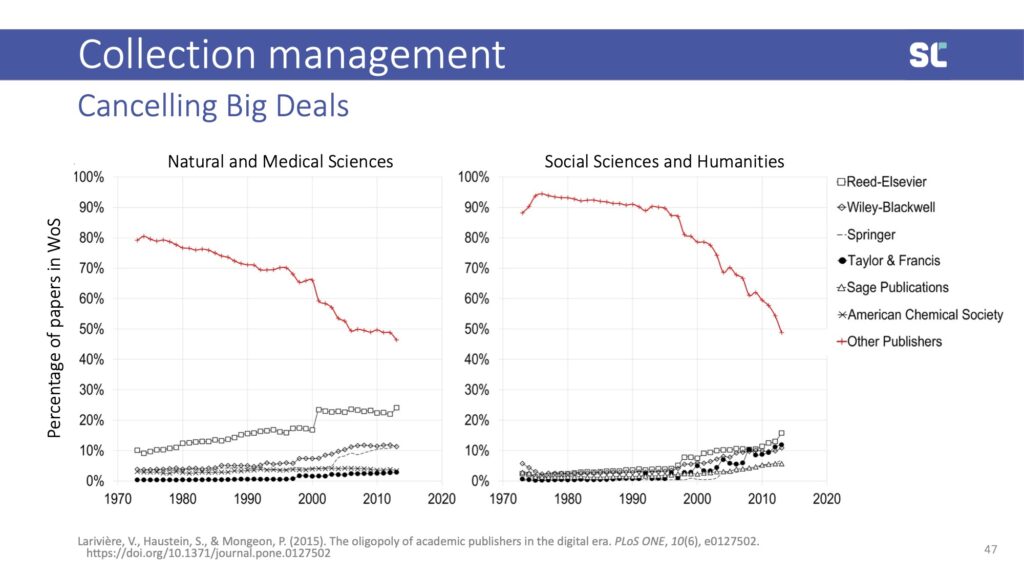
Unpaywall, and their service Unsub, can be used to investigate whether journal subscriptions are still necessary if more and more publications are available open access.
With the shift to open access, bibliometrics has now become an important tool to track the cost of article processing charges. In a 2023 preprint (under review at Quantitative Science Studies), we estimated that, globally, the academic community paid more than one billion U.S. dollars to publish open access to the five-big publishers.
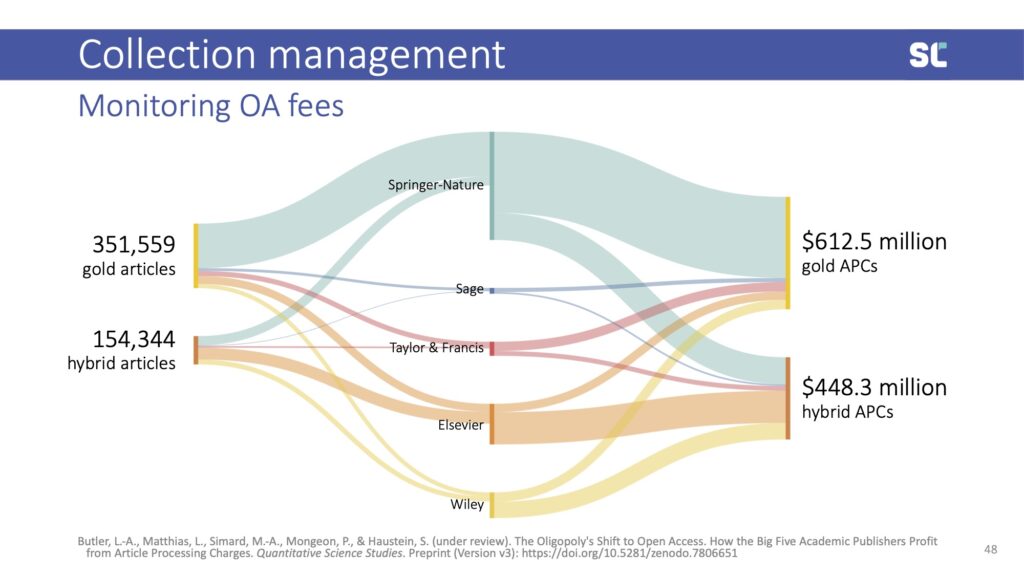
Publication statistics are also used in the context of transformative agreements. For instance, it allows publishers to determine flat rate fees and justify price increases, and librarians to monitor the use of agreements.
Open science monitoring
Another new application area of scientometrics is open science monitoring. With an increasing number of open science policies, funders and policy makers are interested in tracking compliance. From open access, we know that rates of compliance with mandates are significantly higher when they are monitored.
Influenced by developments in open infrastructure, more and more dashboards are being developed to track open practices such as open access publishing and data sharing.
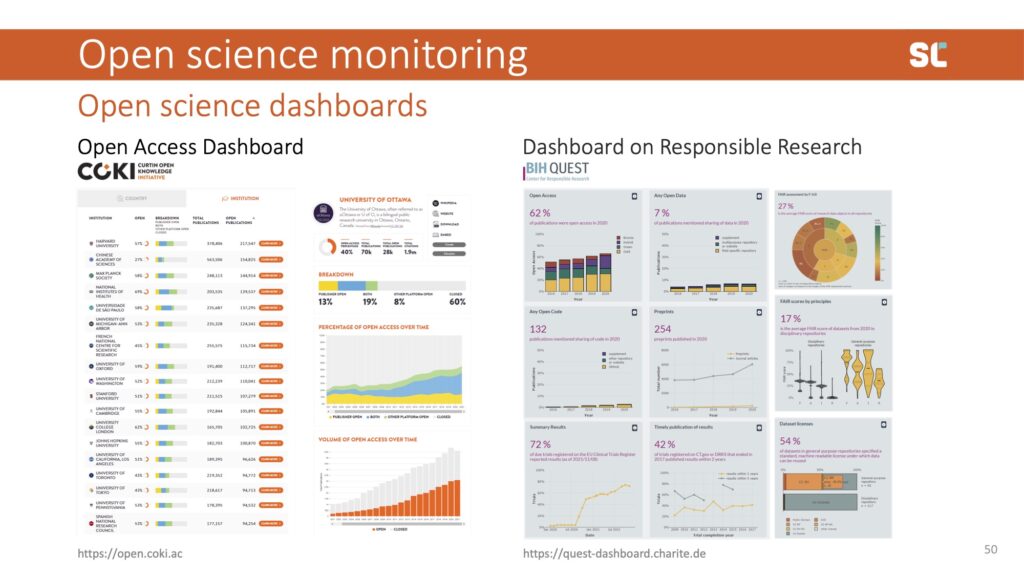
Above, I am showing examples of two dashboards: the Curtin Open Knowledge Initiative Open Access Dashboard and the Charité Berlin Dashboard on Responsible Research. There are many more examples, including the French Open Science Monitor and the European Open Science Cloud.
Most dashboards are similar to bibliometrics in the past: very data driven, tracking what's available. We are taking a different user-centred approach with the open science dashboard for biomedical institutions. Instead of including what’s easily trackable, we first conducted a Delphi study to ask the community what they consider important to open science practices and what to track in a dashboard.
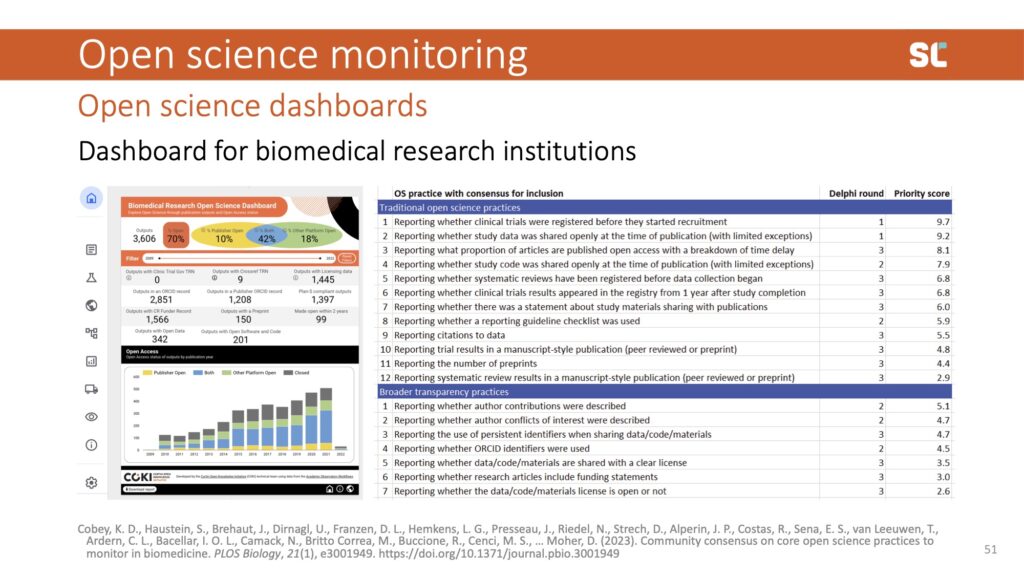
This is certainly challenging since many outputs—especially those that aren’t publications—lack the necessary metadata (e.g., institutional affiliations) to generate all indicators that the community deemed important.
Stay tuned for our next post, in which we’ll share opportunities and challenges of scientometrics, with a focus on the responsible use of metrics and conclusions. Check out the Swiss Year of Scientometrics blog for recordings of Stefanie’s lecture and workshop.
References
Gross, P.L.K, & Gross, E.M. College Libraries and Chemical Education. Science, 66, 385-389 (1927).
Swiss Year of Scientometrics Lecture: Opportunities and Challenges of Scientometrics–Part II
This blog post is the second in a four part series based on the keynote presentation by Stefanie Haustein at the Swiss Year of Scientometrics lecture and workshop series at ETH Zurich on June 7, 2023. Stay tuned for our next post, in which we’ll share opportunities and challenges of scientometrics, with a focus on the diversification of application.
Diversification of research outputs
Publications
Quantitative research evaluation and bibliometric studies in general have traditionally captured and therefore perpetuated what I would call a “biblio-monoculture,” where all that counts is publishing in English language peer-reviewed journals—which are biased towards topics and actors from the Global North, and controlled by for-profit companies that put up paywalls to limit access to literature and bibliometric data.
With the diversification of bibliometric data providers there is the hope to achieve so-called “bibliodiversity,” which values diverse contents, formats, languages, and publishing models.
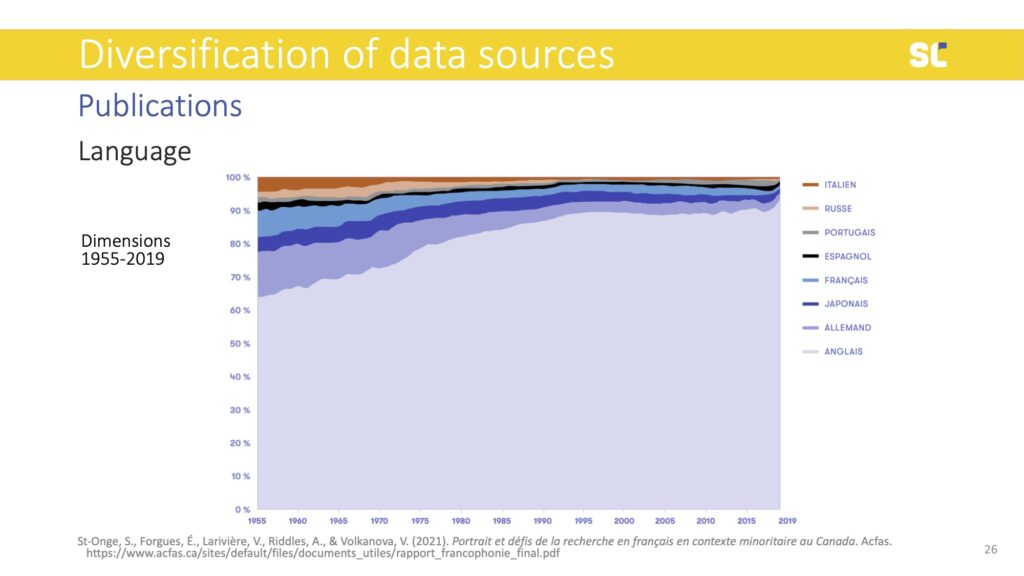
In the figure above, we see that even if databases expand, languages other than English are in steep decline. Although at different timelines, the decline of non-English content happens across all disciplines, including the humanities and social sciences where national languages and regional topics are particularly relevant.
The lack of diversity in bibliometric databases does not only show in languages but also in the representation of authors. Below you see a world map that is distorted according to the number of publications per country in Scopus. Countries like the U.S. and the U.K. were particularly overrepresented, while the Global South is extremely underrepresented.
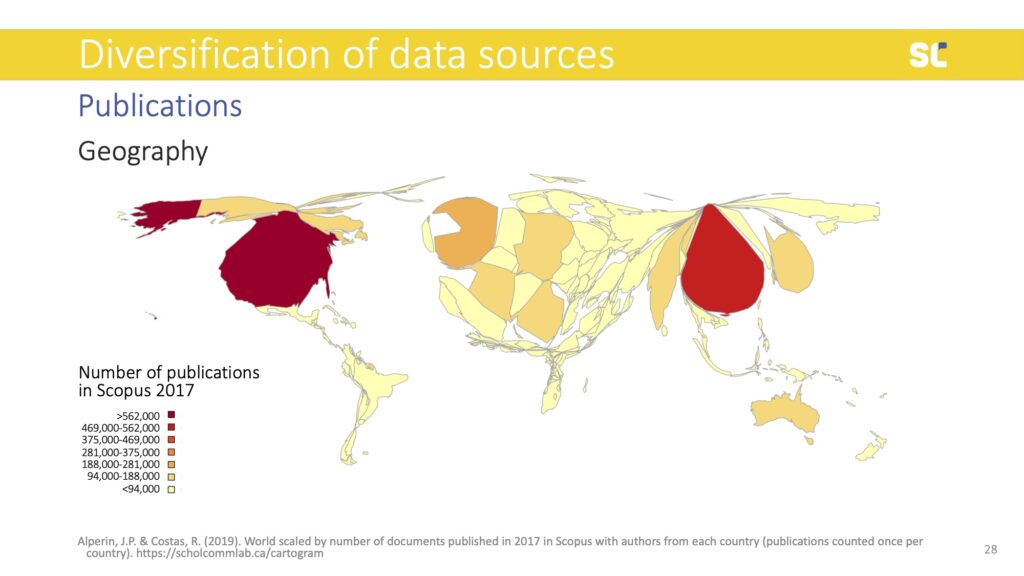
This bias in bibliometric databases has created a research culture where academic publishing that does not conform to the Western STEM model (peer-reviewed journals controlled by large publishers) is more or less invisible.
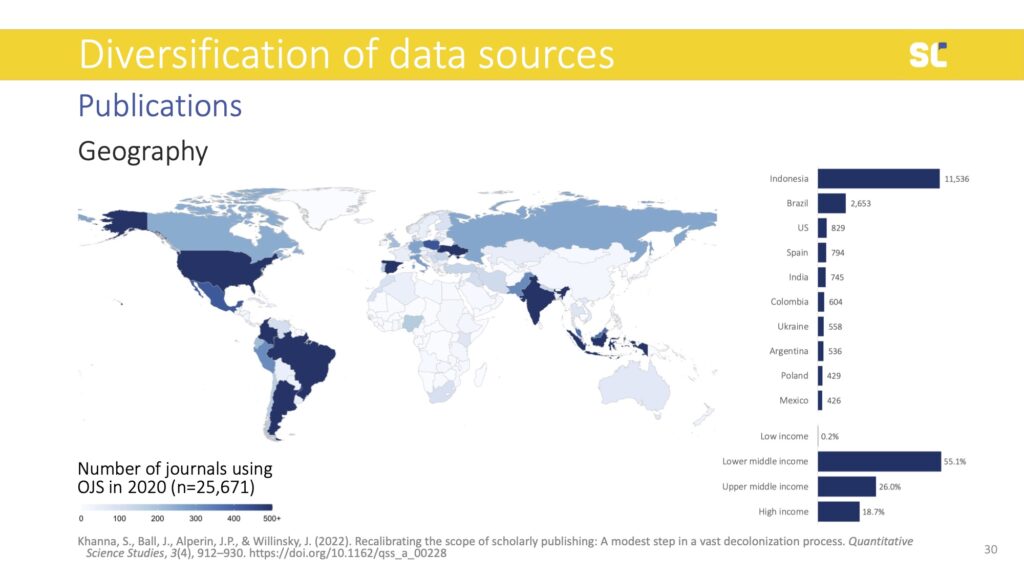
Using different, more inclusive and diverse databases means that alternative publishing models can be made visible. For example, an analysis of journals in the Directory of Open Access Journals (DOAJ) showed that there is a wealth of open access journals that exist in Asia, Latin America, and Eastern Europe that operate without paywalls for authors or readers (so called diamond Open Access journals) or with reasonable and more sustainable article processing charges than their counterparts in Western Europe and North America.
A 2022 study (published in Quantitative Science Studies) found that more than 25,000 journals that use the open-source publishing platform Open Journal Systems (OJS). 80% of the journals operated in the Global South, 84% of which were diamond Open Access. Only 1% of them were indexed in WoS and 6% in Scopus. OpenAlex indexes 64% of these journals, while Dimensions in 54%. This indicates that with these new players, scientometric studies have the potential to become more inclusive.
Data
Besides publications, data has become a valuable research output. The open science movement and an increasing number of science policies now demand or encourage researchers to share underlying data openly when they publish their papers. While there are many advantages of open data—such as increased transparency and reproducibility or fostering reuse and collaboration instead of working in silos—it’s not always easy to do so.
To quote Borgman and Bourne (2022):
“Community incentives for exchanging data are clear; incentives for individual scientists to invest in data management and distribution are less apparent. Disincentives abound, including lack of skills, lack of curatorial personnel, lack of infrastructure for managing and archiving, concerns about privacy and confidentiality of human subjects’ records, intellectual property rights, concerns about being ‘scooped,’ misuses of data, labor to assist data reusers in interpretation, cost, and more.”
I want to present some results from the Meaningful Data Counts research project that is part of the larger Make Data Count initiative that aims to address social and technical barriers to open data metrics.
In order to develop meaningful data metrics we think you need at least a minimum of two essential types of metadata: citations and information about discipline (or fields of research).
Discipline has shown to be an important factor to determine how data is reused, even what constitutes data in the first place is very different between disciplines or even smaller fields of research. For example, in STEM numerical data are very common while in the humanities text is most common.
Even if we look at our own field, what we consider as our data is bibliographic information. This is why Christine Borgman defined data in a very broad way as “entities used as evidence of phenomena for the purpose of research or scholarship.” Basically anything that is used as evidence in research constitutes data.
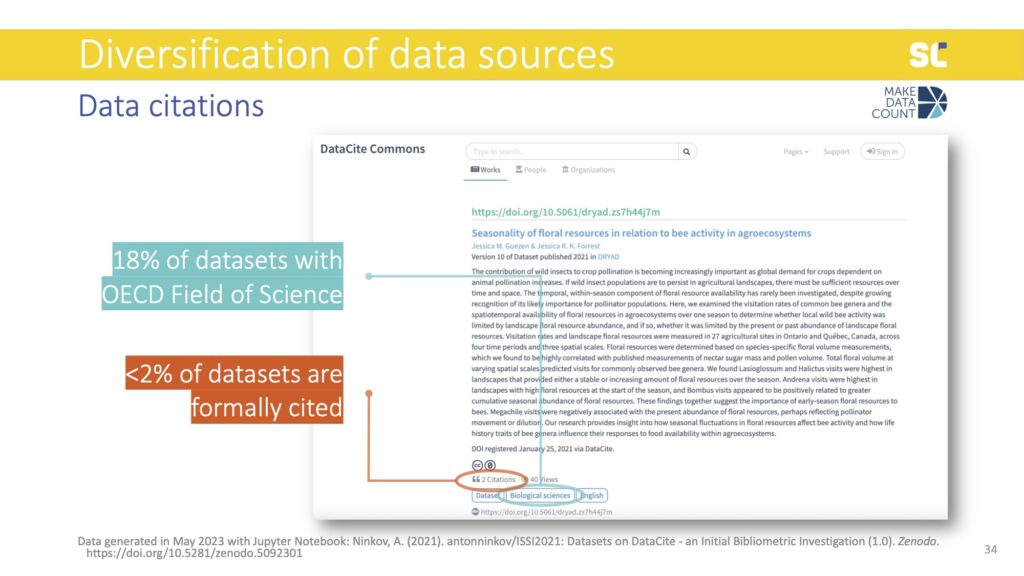
As you can see above, we are in a bit of trouble in terms of these two sources of data that we need to construct data metrics. Of the 14 million datasets in DataCite, only 18% had an Organisation for Economic Co-operation and Development (OECD) Field of Sciences and only 1.5% had been cited. If you consider datasets that have both discipline information and at least one citation, we go down to 0.6% of datasets. Therefore, we are currently lacking essential metadata for research data to construct meaningful data citation metrics.
Beyond discipline, there are plenty of other characteristics that might affect how datasets are getting reused—such as data type, file format, license, repository, etc. There needs to be more research into these to discover patterns that help create benchmarks and normalized indicators. I think what we can all agree on is that we don’t want to recreate mistakes from bibliometrics, where simple and flawed indicators—such as the Journal Impact Factor and h-index—have created adverse effects.
Tracing data
This is why we have done a large survey with almost 2,500 researchers that is stratified by academic discipline. We analyzed differences between disciplines and those items, where statistically significant differences were found between the 6 OECD Field of Sciences are indicated with an asterisk. The results that I am presenting were weighted responses to ensure disciplinary representativity.
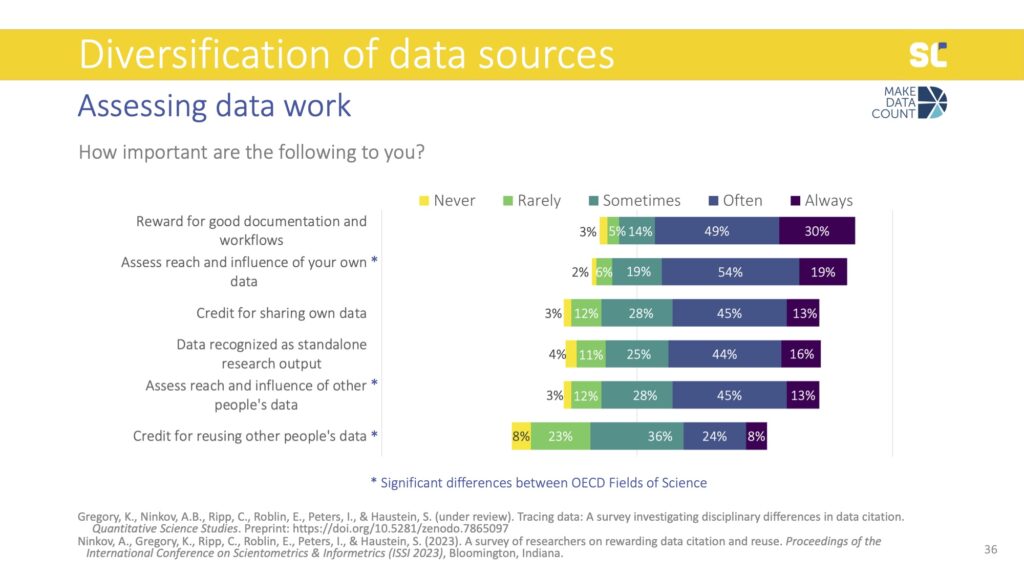
We asked people what they would consider important to reward in the context of data work. All fields showed similar patterns for rewarding good documentation, getting credit for sharing data, and recognizing data as standalone outputs.
Significant differences between the Field of Sciences were also observed for assessing research, including the influence of your own and other people’s data as well as getting credit for reusing other people’s data. These factors were perceived as more important for people in Agricultural Science and Medical and Health Sciences than those in the Social Sciences and Humanities.
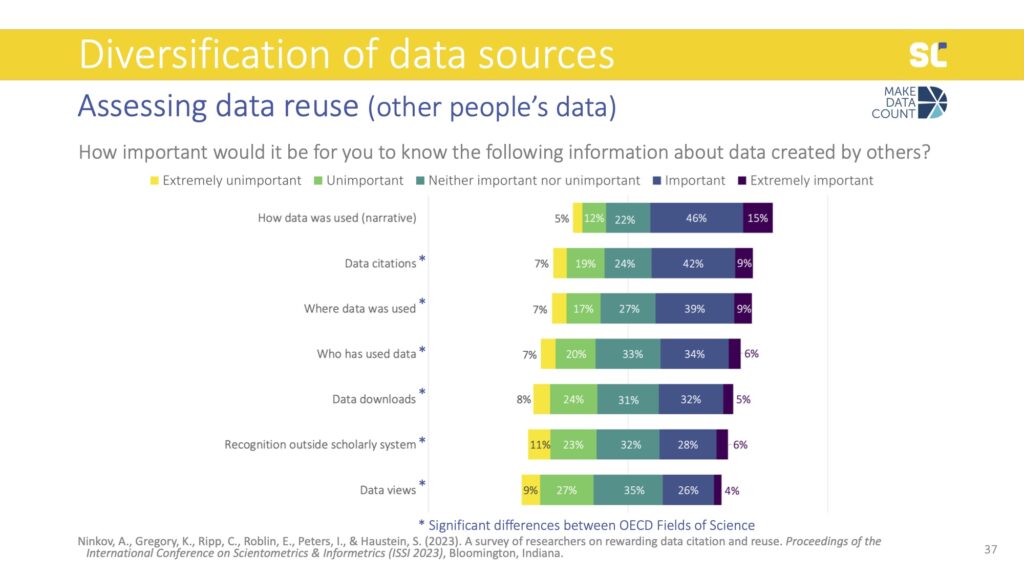
We also asked participants what would be important information to have when assessing data created by others that they might consider to reuse. The most important piece of information about data reuse was having descriptions or narratives that provide details about how the data were already used—and this was the same across all disciplines.
When assessing data created by others, people also felt it was more important to follow the number of citations, where the data was used, and who has used the data, rather than data downloads, views, and recognition outside academia. However, all of these aspects were valued differently across fields of science. For example, data citations were rated as most important in Agriculture, Engineering, and Medicine but least in the Social Sciences.
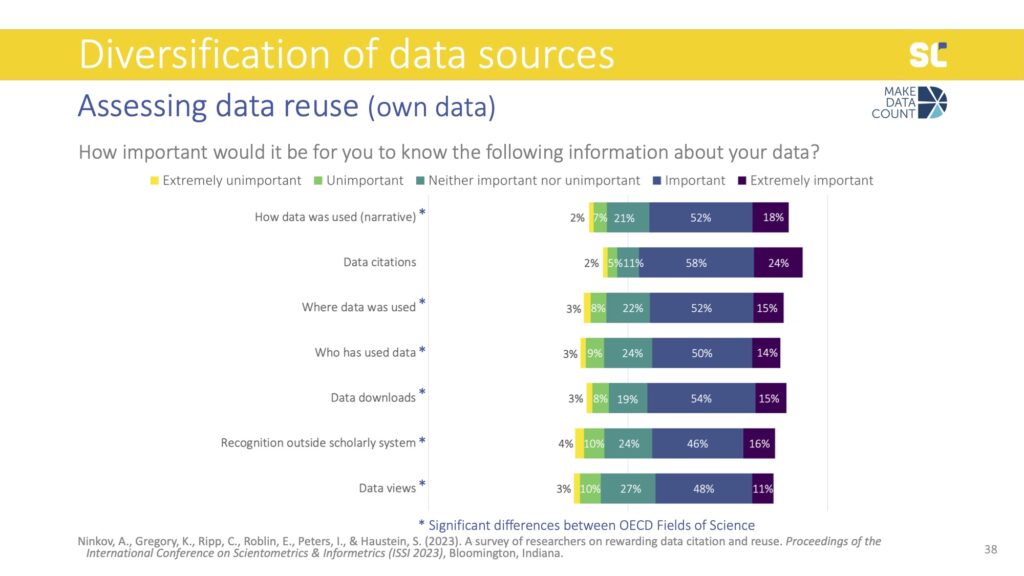
When we asked the same question but this time about their own data, all types of impact indicators were more important and data citations were considered even more essential than the narratives. Data downloads also became slightly more important than the where and who.
There were also significant differences for all items except for data citations, where all disciplines agree that this is the most important. Interestingly, the Social Sciences valued this information about their own data way more than the information about data created by others, while the opposite was true for Engineering.
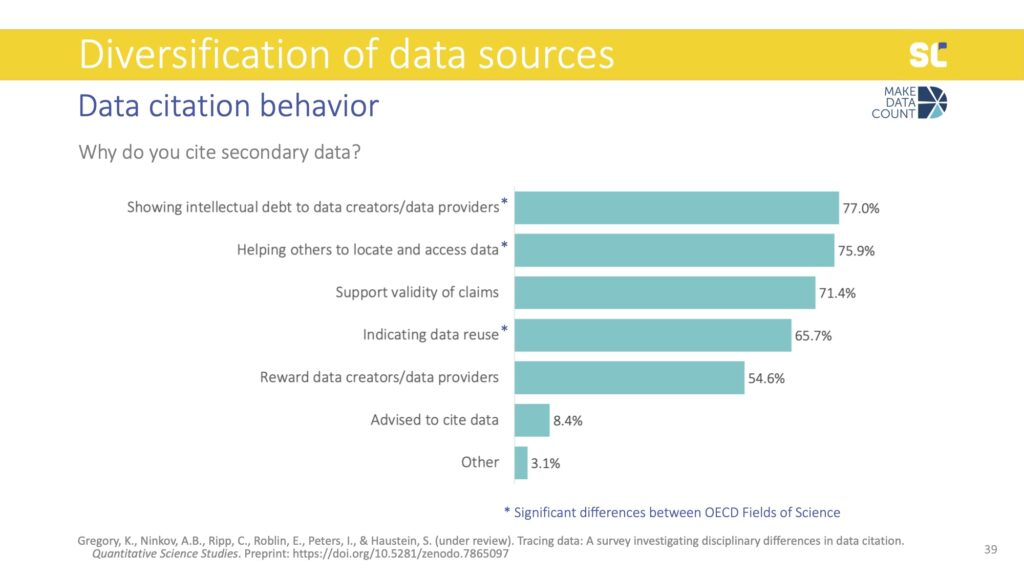
Motivations to cite data were similar to what we know about motivations to cite literature, namely showing intellectual debt (or what Robert Merton called “pellets of peer recognition”), supporting validity of claims, indicating reuse, and rewarding the data creators. Another, more altruistic reason was also to help others locate the data used in the study.
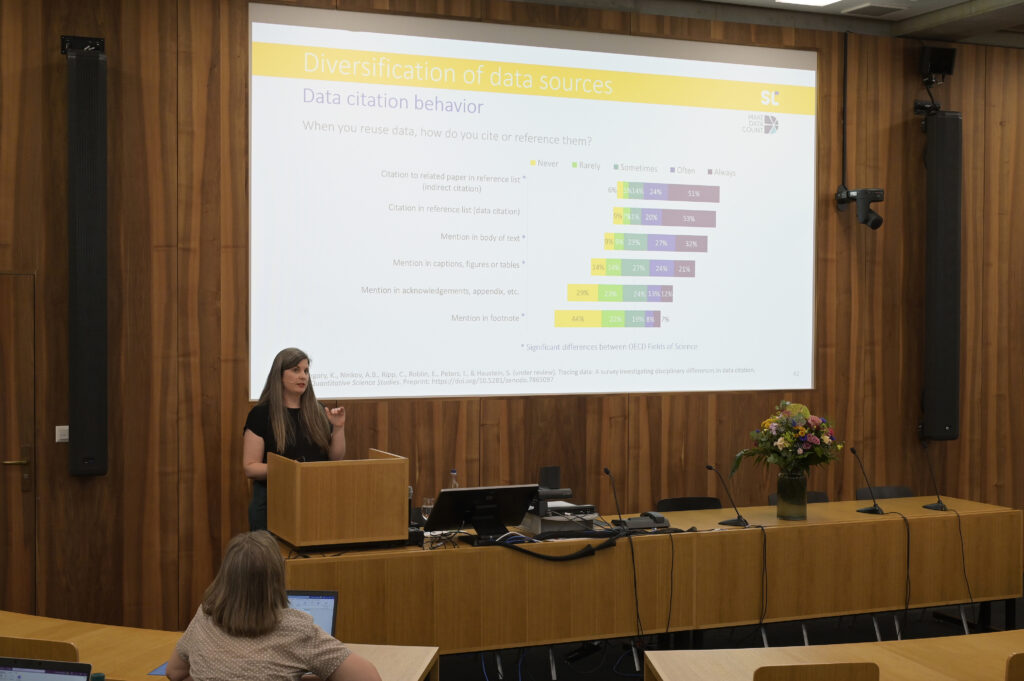
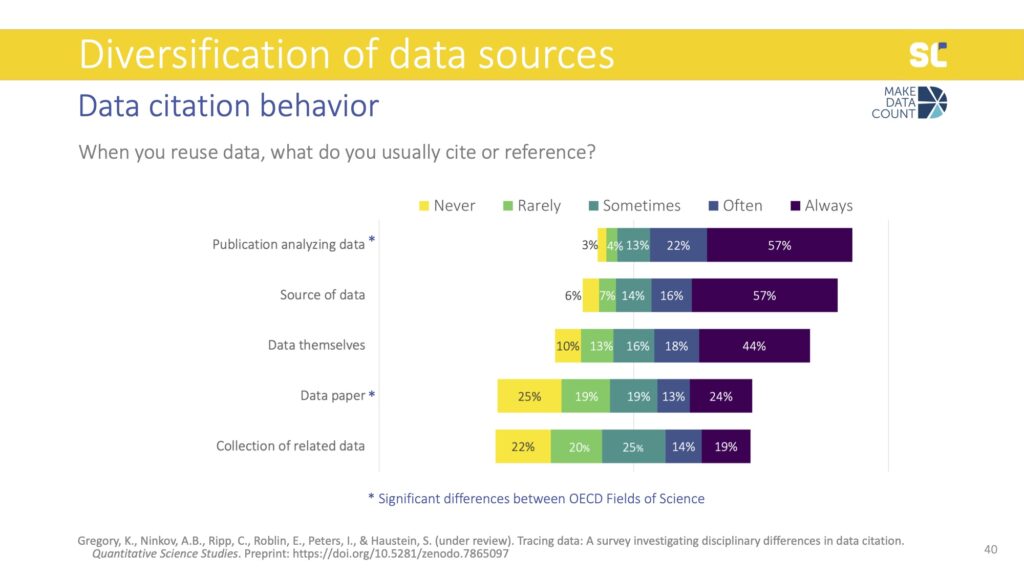
The most common way of crediting data reuse was to cite a paper analyzing the data instead of the data themselves. Citing the source of the data was also more common than actually providing a citation to the dataset directly. From a scientometric perspective this is problematic because data reuse is not directly traceable if only citing related papers.
We also asked how exactly participants cite or reference data. The most common method was to list a related paper in the reference list, which is something we call indirect citations. This reflects the dominance of journal articles and metrics based on literature citations, not on data citations.
Interestingly, data citations—which means citing the data themselves in the reference list—were almost as common as indirect citations, contradicting some previous empirical findings from studies looking at how data is cited in the literature.
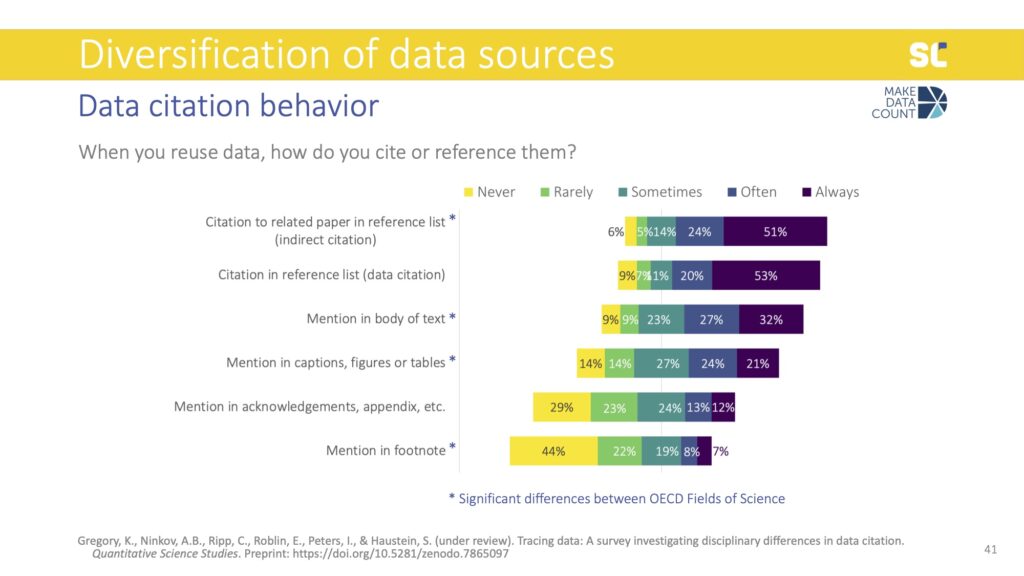
The remaining items focused on what we call data mentions: instead of formally citing data, authors mention them in different parts of the full text—particularly the body of the text but also captions, figures, or tables. This was also found in previous studies, which showed that authors may acknowledge the reuse of data in the full text of the study rather than the reference list. Through follow-up interviews with 20 researchers, we found that some think that mentioning the data in the text of caption constitutes as a citation.
Of course, from our perspective of tracking citations based on references lists, we know that this is not the case. In terms of developing data citation indicators to credit data sharing as an open science practice, a significant share of acknowledgements to data gets lost.
This is why DataCite, in collaboration with the Chan Zuckerberg Initiative, recently received funding from the Wellcome Trust to extract data mentions from the full text of academic literature.
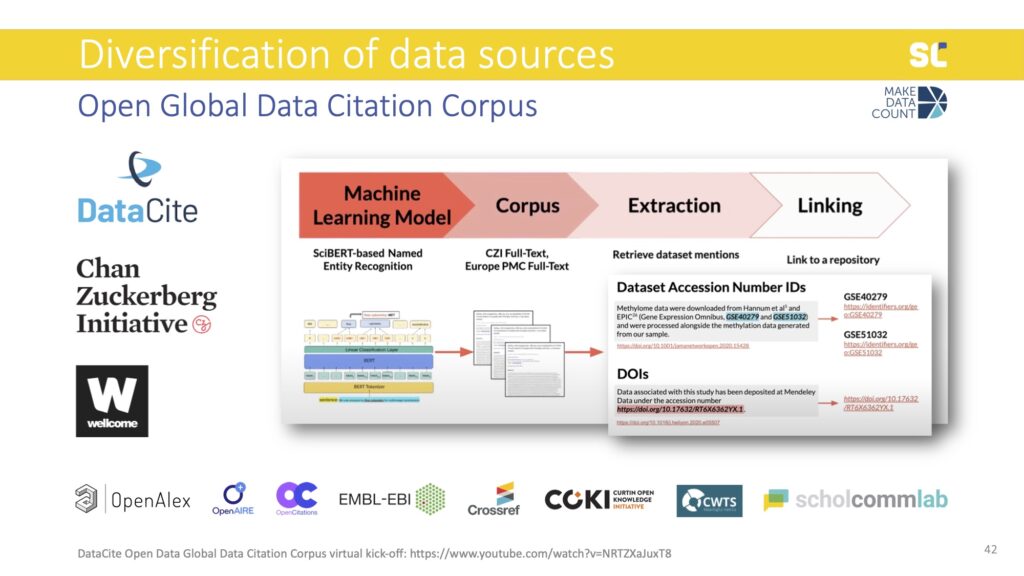
They are developing a machine learning algorithm that is able to extract dataset mentions from full text to fill this gap. The Open Global Data Citation Corpus will thus contain both data citations—as DataCite was previously capturing—as well as data mentions. In addition to DOIs, it will also expand to track dataset accession number IDs, which are more common than DOIs in some fields (mostly in biomedical research).
The Open Global Data Citation Corpus will be an important step towards the development of data metrics in order to reward open science practices, acknowledge the diversification, and value research outputs beyond publications.
Stay tuned for our next post, in which we’ll share opportunities and challenges of scientometrics, with a focus on the diversification of applications. Check out the Swiss Year of Scientometrics blog for recordings of Stefanie’s lecture and workshop, and Zenodo for all Meaningful Data Counts research outputs.
References
Borgman, C. L., & Bourne, P. (2022). Why It Takes a Village to Manage and Share Data. Harvard Data Science Review, 4(3).
Swiss Year of Scientometrics Lecture: Opportunities and Challenges of Scientometrics–Part I
This blog post is the first in a four part series based on the keynote presentation by Stefanie Haustein at the Swiss Year of Scientometrics lecture and workshop series at ETH Zurich on June 7, 2023. Stay tuned for our next post, in which we’ll share opportunities and challenges of scientometrics, with a focus on the diversification of research outputs.
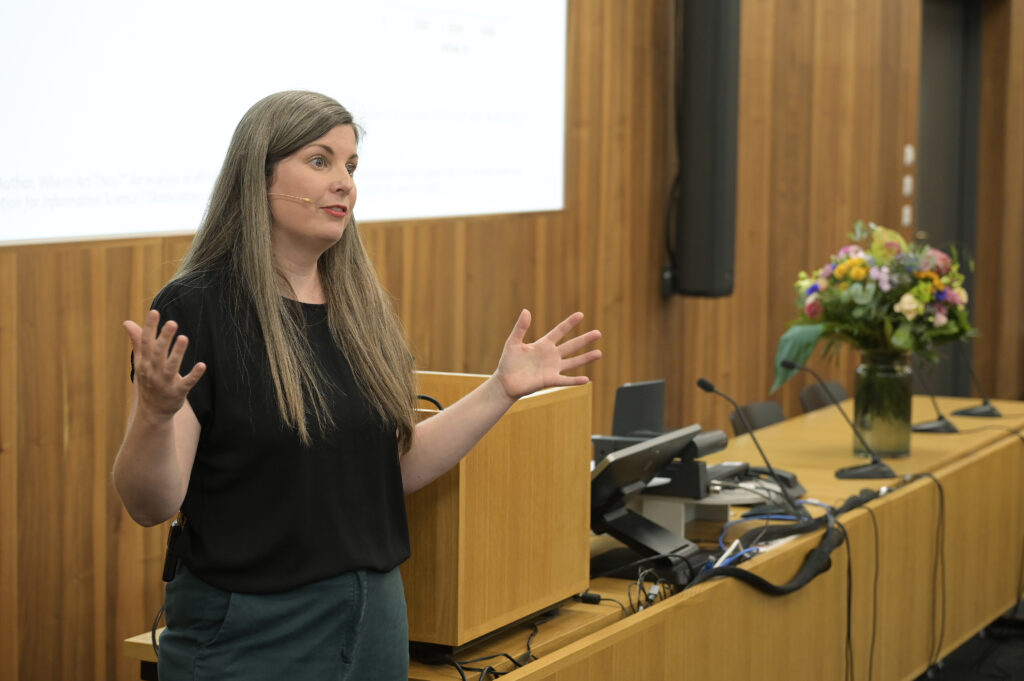
Thank you to David Johann and Annette Guignard at ETH Library for inviting me to open this lecture series for the Swiss Year of Scientometrics.
In the hope of inspiring some interesting discussions, my goal is to provide you with a very broad overview of a number of opportunities and challenges of scientometrics, with a focus on the diversification of data sources and areas of application.
I will talk about how the data sources for bibliometric analysis are becoming more diverse, both from the perspective of data providers and the types of research outputs considered.
With respect to new areas where scientometrics can generate an evidence base, I will briefly address library collection management, open science monitoring as well as the responsible use of scholarly metrics.
I’ll conclude the talk with some reflections on what I consider the main opportunities and challenges of scientometrics today.
Diversification of data providers
The number of companies providing bibliometric data has really exploded in recent years. Some of you might still remember the times when the Web of Science was the only option for citation analysis.
While closed infrastructure and proprietary data sources were the norm for decades, we now see an explosion of open infrastructure developments. In my opinion, a particularly exciting development is the flip from closed to open infrastructure—when OurResearch took over Microsoft Academic Graph (MAG) and turned it into OpenAlex.
The open players—OpenAlex, Crossref and DataCite—are committed to a set of guidelines called the Principles of Open Scholarly Infrastructure (POSI). These guidelines prescribe, for example, that the infrastructures should be steered collectively by the community, not by lobbyists, and that revenue generation is mission oriented and based on services, not on selling data. In fact, all data and software of these organizations should be open and not patentable.
OpenAlex
When Microsoft decided to cease operations, the non-profit OurResearch with support from a $4.5 million grant from Arcadia decided to further develop MAG and turn it into open infrastructure that is accessible via API, a data dump, and (since very recently) a user interface.
Apart from it being open and free to reuse for any purposes, OpenAlex’s unique selling point is certainly its coverage and size, making it a great potential source for more inclusive bibliometric analyses.
Approaching its metadata from a bibliometric perspective, OpenAlex provides the basic building blocks for the analysis of research outputs and impact. OpenAlex is a heterogeneous directed graph linking research outputs, called Works, as well as information about who published them, where they were published, their research area, and even who funded it.
Since OpenAlex was only recently launched, we don’t know much yet about the feasibility for scientometric analyses. So I want to explore two crucial metadata elements in a bit more detail: institutional affiliations and disciplines.
Author addresses on academic publications provide us with information about their institution. In this example, you see that this author was affiliated with Simon Fraser University in Canada:
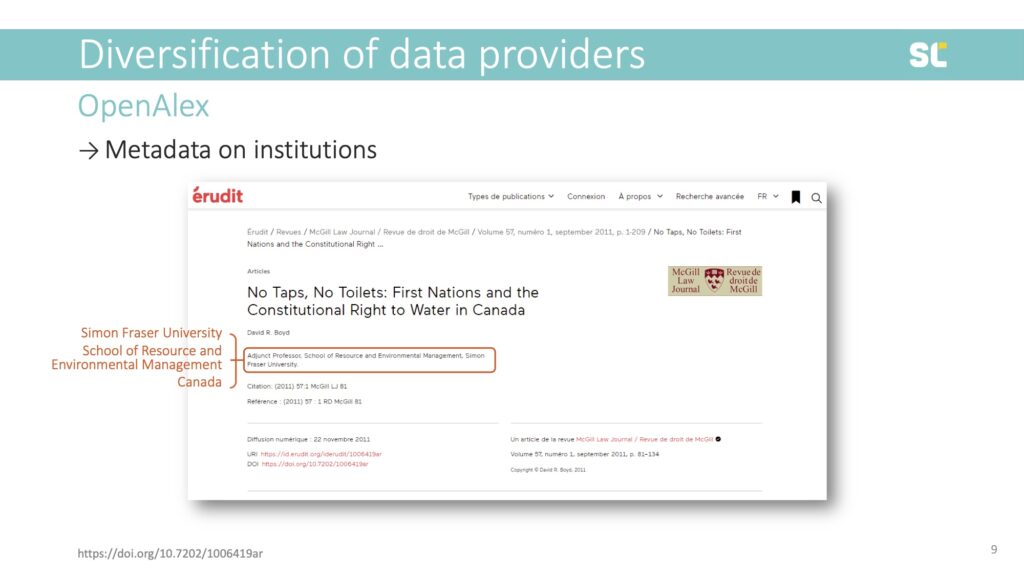
These elements form the basic building blocks for an institutional analysis on the meso and macro levels of bibliometric analysis, providing us with the university, department, and country of the author.
OpenAlex uses an algorithm to link institutional information to the Persistent Identifier from the Research Organization Registry (ROR ID), combining metadata from Crossref, PubMed, ROR, Microsoft Academic Graph, and publisher websites. Through this enriching process, every institution in OpenAlex is supposed to have a ROR ID.
In this example, however, we see that OpenAlex does not have any institutional metadata even though the original publication did:
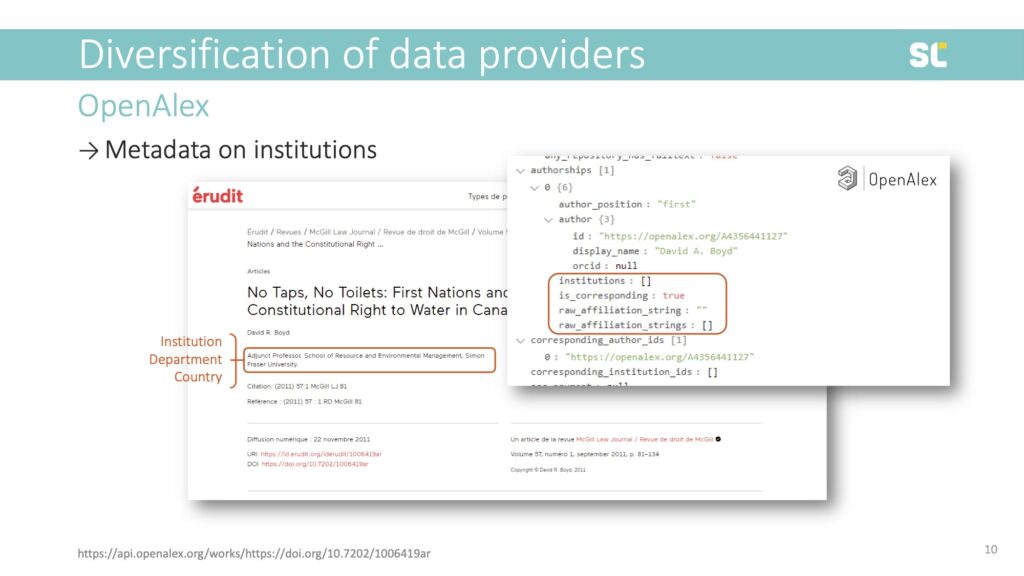
By the way, the same is true for this paper in Dimensions, which likely means that the publisher did not provide institutional information to Crossref.
So what does this mean bibliometrically? While this article could be tracked via DOI, author name, or journal, it would not be included in any analysis that relies on country or institution, either as a method of retrieval, or unit of analysis. This paper would neither count as an output for Canada nor Simon Fraser University because the metadata is missing.
My colleague Simon van Bellen at the Canadian journal platform Érudit analyzed the presence of RORs in OpenAlex for all papers published in Canadian social sciences and humanities journals from 2012 to 2021. He found that 63% of papers were retrievable via ROR ID, which means that over one third of papers did not have an institutional address.
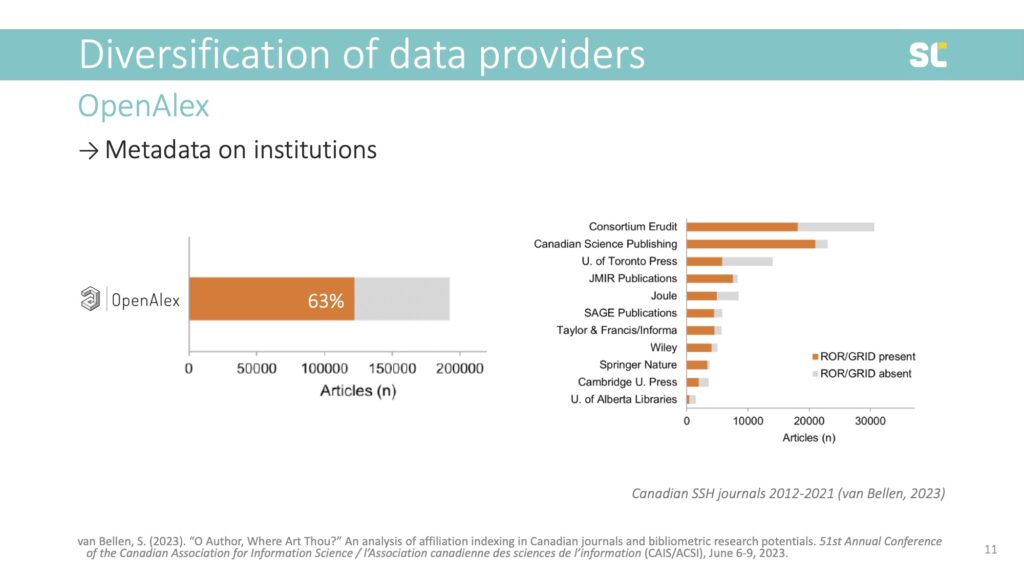
What is even more alarming is the huge differences between publishers. For example, while institutional metadata was present in 90% of journals published by Springer-Nature, the non-profit Consortium Erudit had institutional metadata in only 59% of their published papers.
This means that the metadata that publishers provide affects the visibility of these papers in bibliometric analyses using OpenAlex or Dimensions. So even if these larger more inclusive databases now cover more outputs, they don’t necessarily translate into more and more diverse outputs on the institutional or country level.
Disciplinary metadata is particularly important in scientometric analyses for benchmarking and normalizing field-specific publication and citation practices.
OpenAlex uses Wikidata concepts for subject indexing. Concepts are assigned automatically based on title, abstract and journal, conference or book title. Concepts are hierarchical with five levels for a total of 65,000 concepts.
This classification system is a modified version from Microsoft Academic’s fields of study, which has been criticized by Sven Hug and colleagues (2017) who concluded that it would not make a good base for bibliometric indicators due to the dynamic number of fields and inconsistent hierarchies.
Although they are made to look like a true hierarchical classification system with an astonishing number of classes, concepts do NOT fulfill the properties of a regular classification system. For example, in the slide below, you see the first two hierarchies and that many of these have two parent classes.
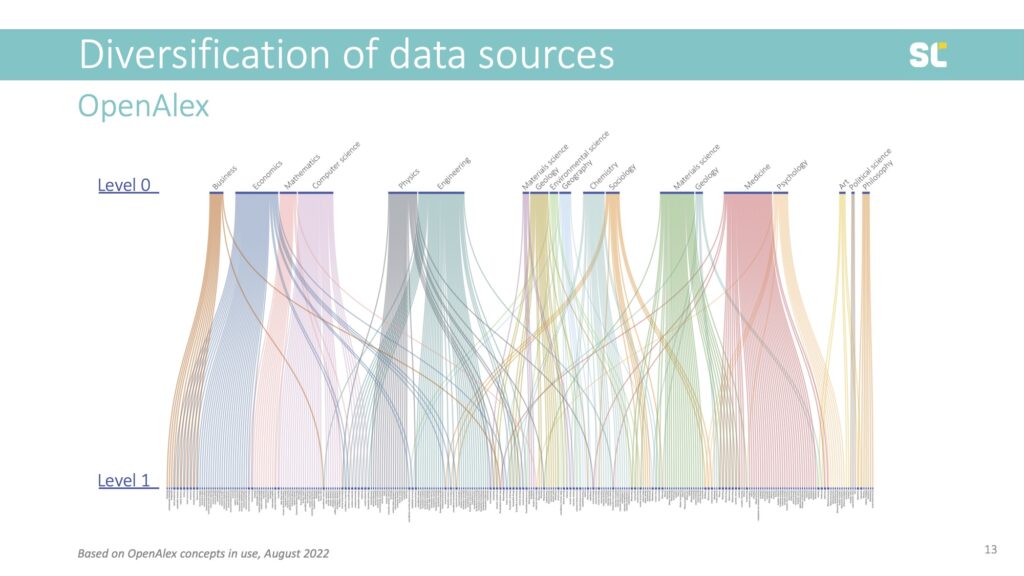
Moreover, the quality of some index terms is questionable and so are some of the hierarchical relationships. For instance, Literature L1 (under L0 Art) has 391 level 2 classes, including geographical classes (Italian literature, Scottish literature), classes about literary movements (modernism, absurdism) or literary criticism (reception theory), genres (detective fiction, travel writing) as well as concepts that certainly shouldn’t be found on the third hierarchy level, or not even be classes at all—such as individual Shakespeare plays like Hamlet, Star Trek, or Harry Potter[1].
Another severe issue is also that there is no vocabulary control in the OpenAlex concepts. For example, homonyms are not distinguished. As shown in the slide below, this book review published in the Sixteenth Century Journal and this conference paper published in a Lecture Notes in Computer Science book series are tagged with the same concept.
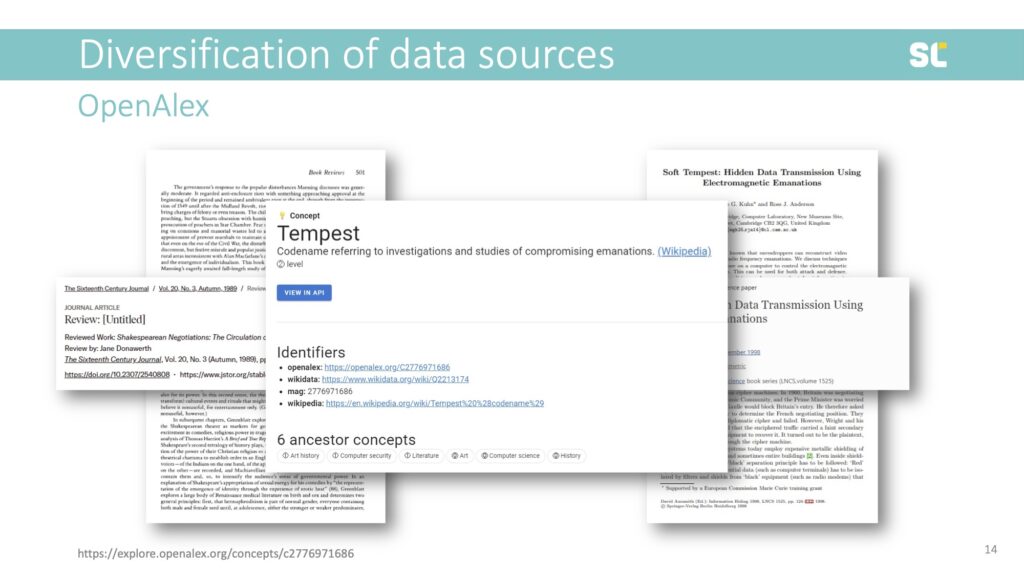
“Tempest” is a Level 2 term (third level of hierarchy) and a subordinate class of Literature, Art History, and Computer Security. The Tempest is a play by Shakespeare but also an acronym for “Telecommunications Electronics Materials Protected from Emanating Spurious Transmissions,” which is the US National Security Agency’s specification for protecting against data theft through the interception of electromagnetic radiation.
Another example are these two papers, one published in a journal called Agricultural and Food Chemistry and one in IEEE Signal Processing Letters.
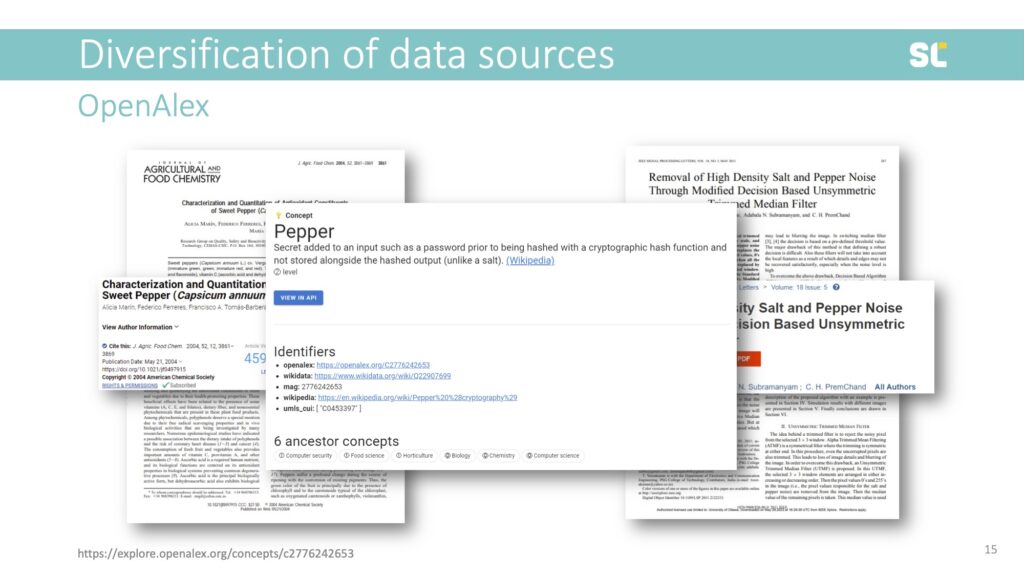
“Pepper” is a Level 2 class, with three different parent classes: Food Science, Horticulture, and Computer Security. This shows that the concepts in OpenAlex are highly problematic and should at this point not be used for bibliometric analyses.
However, I want to emphasize the recent launch of OpenAlex and that in my opinion it provides a huge opportunity to build an open, community owned system that can be more inclusive if metadata quality and completeness are addressed. I think that we need to invest in this open infrastructure and contribute to improving quality as a community.
Elsevier
I now want to talk about Elsevier, who has been a bibliometric data provider through Scopus for several decades. But instead of talking about Scopus as such, I want to highlight how it has become an information analytics business that has been collecting metadata of scholarly outputs for almost 150 years.
I also want to highlight the aspect of Elsevier being a highly profitable business. As Sarah Lamdan highlights in her recent book Data Cartels, “Elsevier focuses on crunching academic researchers’ data in new ways to make money off the research process.”
Elsevier is part of the RELX Group, representing the Scientific, Technical, and Medical segment. What is clear is that it is no longer just a publisher, it’s a data analytics company. Databases, tools, and electronic reference generate almost as much revenue as publishing.
But it’s because of the wealth of information and decades of electronic and online data collection that Elsevier has become so powerful. They have built an incredible data analytics pipeline by collecting data and acquiring tools and platforms that capture the entire research cycle and research evaluation process (see below).
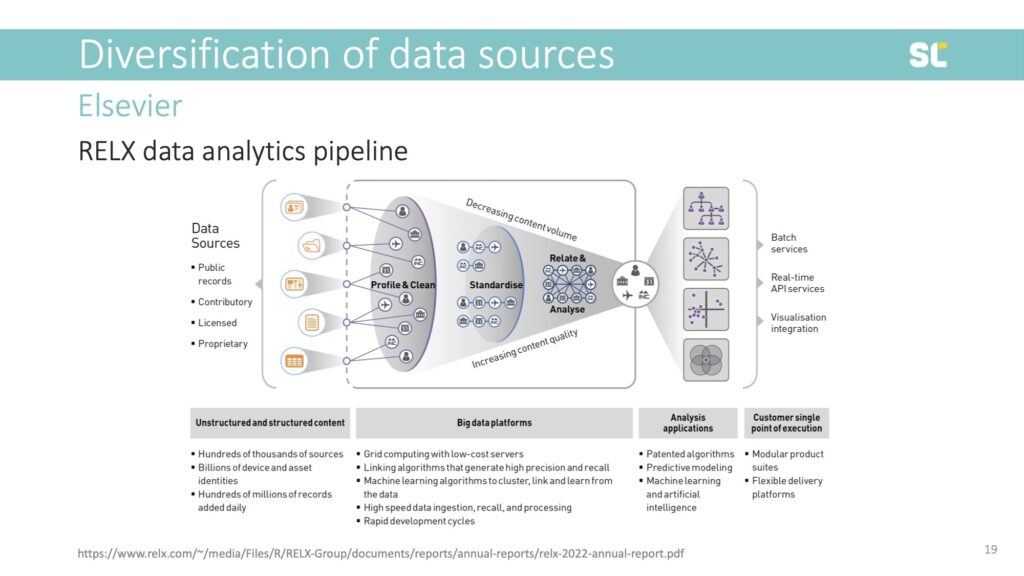
This would be incredible infrastructure for the academic community but because Elsevier is a private company and not a community organization working for the public good, it does what it’s supposed to do: “monetize the entire knowledge production cycle” (Lamdan, 2023, p. 53) and sell raw data from content created by the academic community and data about people who access this content, back to its customers in a plethora of services.
Last year alone, Elsevier created 2.9 billion pounds in revenue and 1.1 billion pounds profit. In the last 10 years, as shown below, their profit was 9.1 billion pounds. That’s almost 12 billion Swiss franc or 11.3 billion euros.
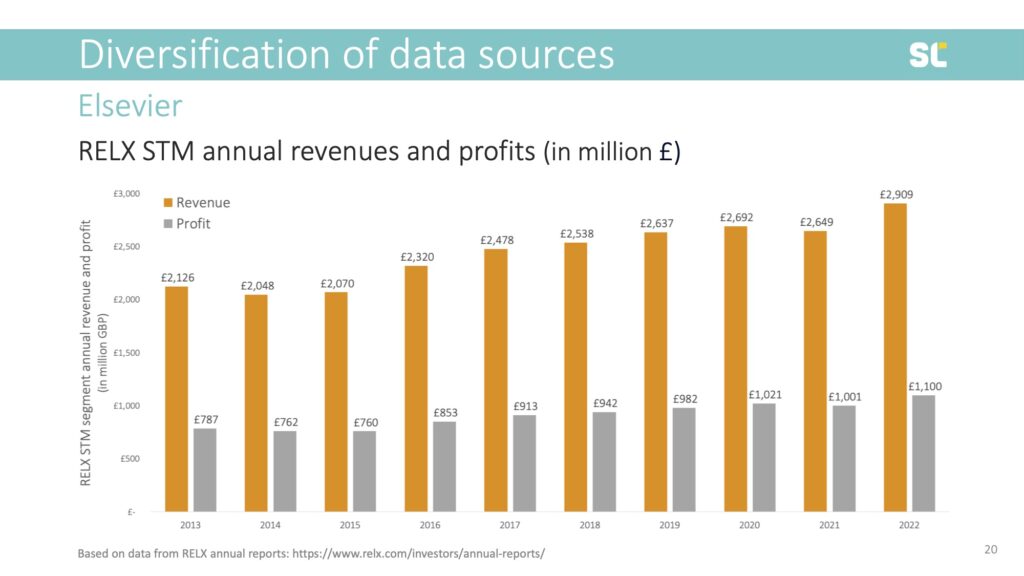
Elsevier’s profit margin is very stable, at 38% annually, because most of their content is provided for free, be it authors’ manuscripts, peer review, or the digital traces left by those accessing the content. This means that for every 1,000 euro spent by the scholarly community on article processing charges, journals or database access, 380 euro leaves the system to pay shareholders—people that were smart enough to invest in RELX stock.
Looking ahead, Elsevier is expecting to grow and further increase profits.
From a scientometric perspective, Elsevier controls and maintains a wealth of rich, connected metadata about the entire research lifecycle. For the academic community, this comes at unsustainable costs. It makes one think what could be possible if just a fraction of these amounts would go into supporting open infrastructure, both for publishing and scientometric analyses.
Stay tuned for our next post, in which we’ll share opportunities and challenges of scientometrics, with a focus on the diversification of research outputs. Check out the Swiss Year of Scientometrics blog for recordings of Stefanie’s lecture and workshop.
References
Hug, S.E., Ochsner, M. & Brändle, M.P. Citation analysis with microsoft academic. Scientometrics 111, 371–378 (2017).
Lamden, S. Data Cartels: The Companies That Control and Monopolize Our Information, Stanford University Press (2023).
van Bellen, S. "O Author, Where Art Thou?" An Analysis of Affiliation Indexing in Canadian Journals and Bibliometric Research Potential. CAIS-ACSI 2023, Canada. Zenodo (2023).
Footnotes
[1] Special thanks to University of Ottawa ÉSIS students Alexandra Auger, Karinne M., and Caroline Plante for analyzing the OpenAlex concepts Literature class in detail.
ScholCommLab at ACFAS 2023
By Chantal Ripp, with editorial support by Olivia Aguiar
The 90th annual ACFAS conference was held at the Université de Montréal, HEC Montréal, and Polytechnique Montréal from May 8 to May 12, 2023. Over the years, the ACFAS Congress has become the largest multidisciplinary gathering of Francophone scholars, attracting participants from around the world.
Under the theme "100 years of knowledge for a sustainable world," this edition offered a rich scientific program to highlight the place of research and knowledge in our societies, and their contributions to the common good.
Seven lab members—Juan Pablo, Rémi Toupin, Anton Ninkov, Chantal Ripp, Leigh-Ann Butler, Marc-André Simard, and Stefanie Haustein—attended or presented sessions at the "Perspectives sur la publication et les revues savantes : évolution du libre accès, des pratiques d’évaluation et des nouvelles possibilités de recherche (Perspectives on publishing and scholarly journals: Evolution of Open Access, review practices and new research opportunities)" colloquium.
-
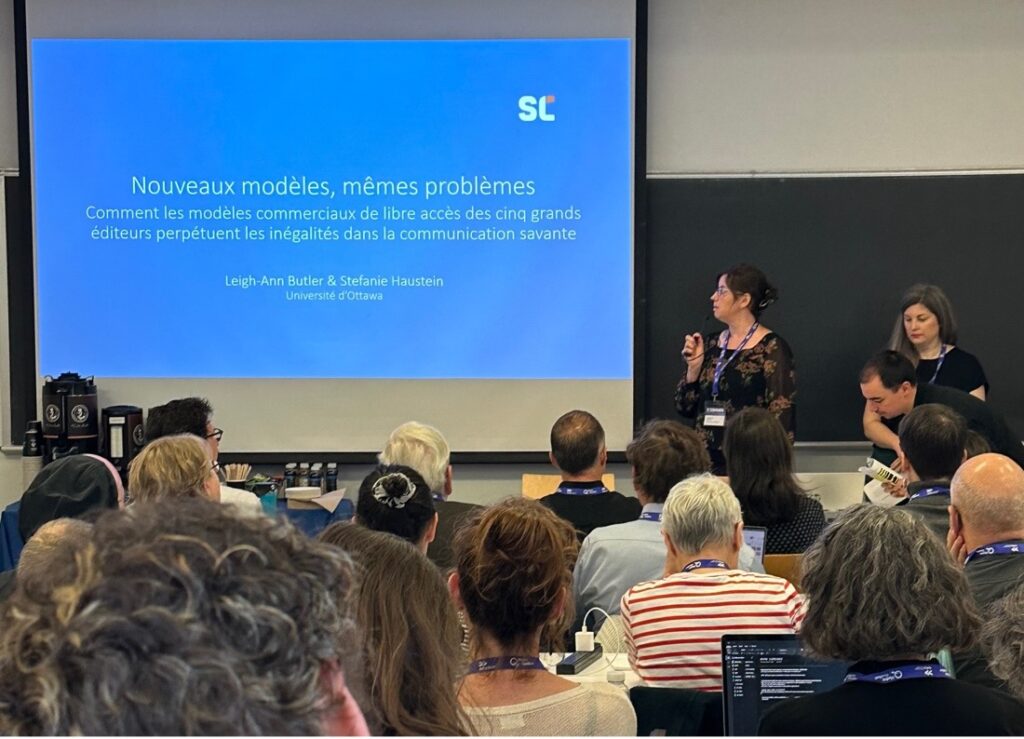
Leigh-Ann Butler (left) and Stefanie Haustein (right) co-present on “New models, same problems: How the big five publishers' open access business models perpetuate inequalities in scholarly communication” at ACFAS 2023 | Photo by Chantal Ripp -
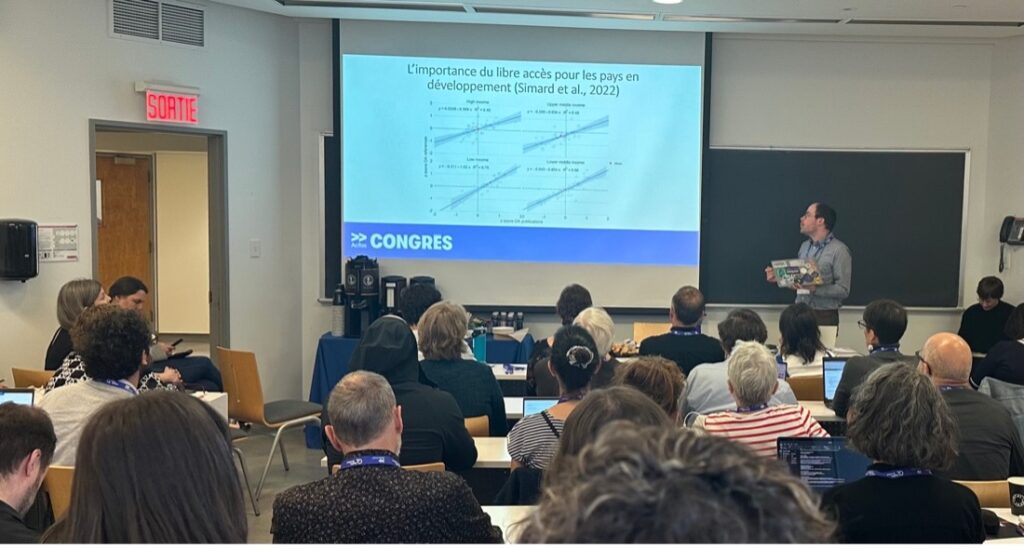
Marc-André Simard presents on “International comparison of open access journals and their use of article processing fees” at ACFAS 2023 | Photo by Chantal Ripp. -
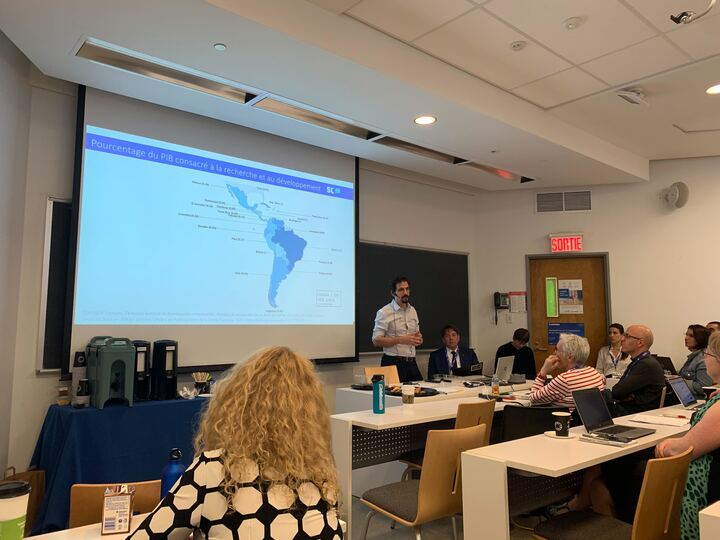
Juan Pablo Alperin presents on “Publication incentives in Latin America” at ACFAS 2023 | Photo by Chantal Ripp
The two-day colloquium explored the evolution of scholarly publishing, new opportunities offered by digital research infrastructures, as well as challenges and opportunities faced by Quebec and Canadian journals as they transition to open access. The participation of many lab members at the conference reflects the lab’s promotion and dissemination of scholarly communication research in French and English.
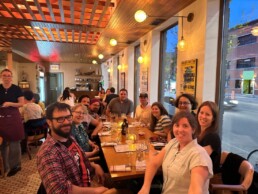
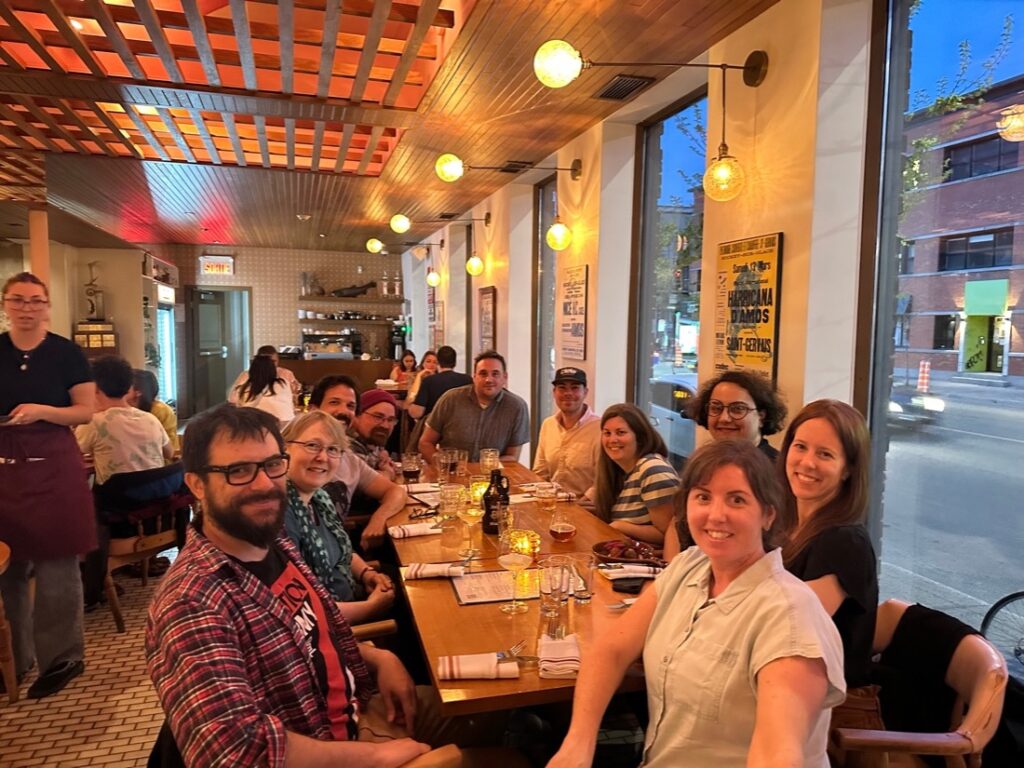
In addition to the captivating sessions at ACFAS, members of the lab were also excited to (re)connect in-person and chat over dinner. "Having a virtual space to collaborate with colleagues is great, but getting the opportunity to spend time in person is worthwhile, especially as so many of the lab members are spread across Canada. As a new PhD student, it's a great way to feel that sense of camaraderie," says Chantal Ripp. "It was my first ACFAS event and I am looking forward to attending again!"
For more on the conference, check out the conference website and program. The University of Ottawa will host the 91st annual ACFAS conference in 2024.